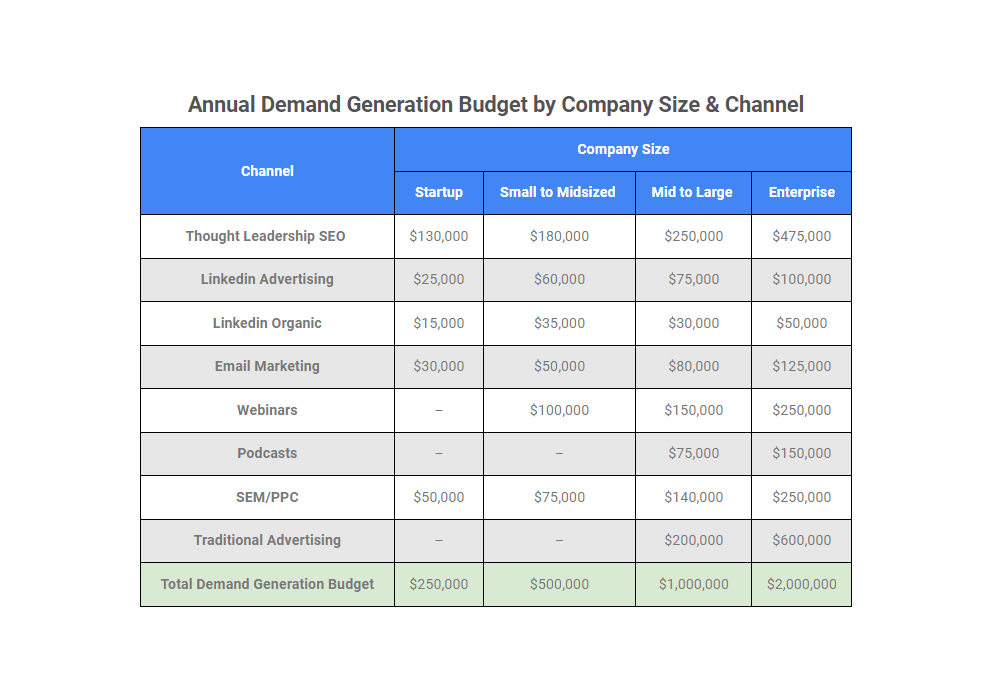
In 2020, the average annual B2B content marketing budget among all businesses was $185,000, with top performers spending closer to $272,000 on average. The larger companies budgeted just over $400,000, and roughly 10% of businesses spend upwards of $500,000 or even $1 million on their content creation each year.
When you’re spending that much budget, you need to be sure you’re allocating resources to your content marketing campaign in ways that support your corporate goals, whatever they may be. Setting realistic benchmarks for success and tracking Key Performance Indicators (KPIs) denoting your progress is a vital part of measuring the effectiveness of your corporate blog.
Below, I share the most common goals for B2B content marketing and then list eight benchmarks that indicate whether your efforts are on track.
Goals of B2B Content Marketing
Our experience with B2B clients has shown us that the following content marketing goals matter most:
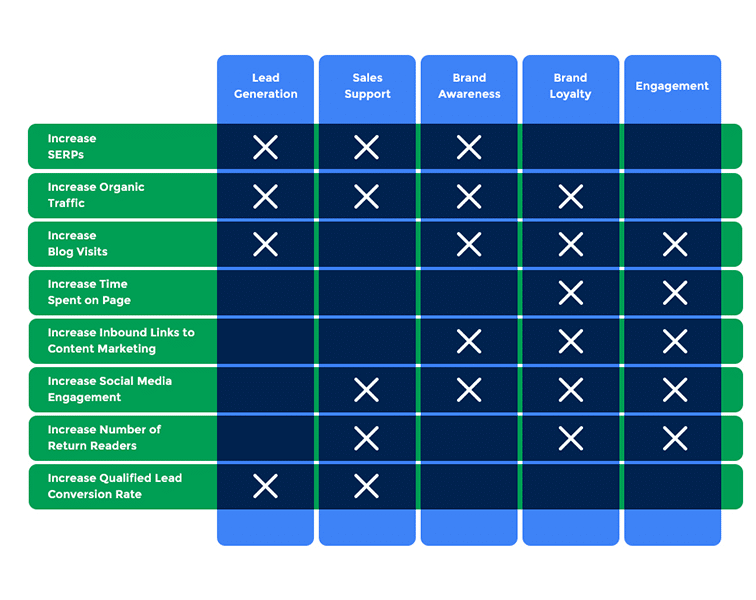
- Lead Generation — If a blog is the first page someone lands on before converting to a sale, it’s great evidence that your content marketing team brought in a new customer and is successfully generating leads. KPIs for measuring lead generation include Search Engine Ranking Position (SERP), blog visits, and website visitor to MQL conversions.
- Reader Engagement — When visitors spend more time on your website, that leads to more opportunities to demonstrate that your company is the best in the field. KPIs for measuring engagement include time spent on page, inbound links, social media shares, return readers, and qualified lead conversions.
- Sales Support — Often your potential customers are looking for a solution to a specific problem or an answer to a specific question. When you have a blog post dedicated to that topic, it’s a great resource for both customers that reach your website through Google and for customers who are already in contact with your team. KPIs for measuring sales support include organic traffic, SERP, return visitors, social media interactions, and MQL to SQL conversions.
- Brand Awareness — Making your brand synonymous with the service you provide will make you the first choice when someone needs your services. KPIs for measuring brand awareness include number of blog visits, organic traffic, SERP, social media activity, return visitors, and inbound links.
- Brand Loyalty — Building loyalty and trust with existing customers not only results in long-term sales opportunities with that customer, but also means that those customers refer you to their colleagues. KPIs for measuring brand loyalty include organic traffic, return blog visits, social media shares, time spent on page, inbound links, and return customers.
Here are the same goals in pie chart form, weighed by their importance based on our experience with clients:
 Benchmarks for Content Marketing
Once you know the goals for your campaign, you need to be able to measure its performance. The following benchmarks will help you do that. If you haven’t set benchmarks for a content marketing campaign before, the following table will help you determine which KPIs to track.
KPI |
Marketing Goals Achieved | Targets |
| Increase SERPs | Lead Generation, Sales Support, Brand Awareness | We want you to rank in the top 3 for 5+ of the most transactional keywords. We want your main blog page to rank in the top 3 for competitive industry keywords via the Hub & Spoke model. |
| Increase Organic Traffic | Lead Generation, Sales Support, Brand Awareness, Brand Loyalty | Organic traffic should increase 10% month-over-month, with roughly 30% of new users and 70% of total traffic arriving through organic channels. We strive to see more than 4.5% of that traffic return within 90 days, with a 16% organic traffic conversion rate. One in 10 blogs should be generating more traffic as time marches on. |
| Increase Blog Visits | Lead Generation, Engagement, Brand Awareness, Brand Loyalty | At least 5% of total site leads should stem from the blog, with visits increasing 5% month-over-month. More than 25% of visitors landing on the blog should continue on to other pages within the site through the links provided. Ideally, we’d like to see 10,000 or more visitors to the blog each month. |
| Increase Time Spent on Page | Engagement, Brand Loyalty | The average person spends 37 seconds skimming an article, so anything under 20 seconds is a red flag that you’re attracting the wrong crowd or missing the mark in capturing attention. Over two minutes is considered a good amount of on-page engagement. Three or more minutes is even better. |
| Increase Inbound Links to Content Marketing | Engagement, Brand Awareness, Brand Loyalty | We aim to have 40% of inbound links from top-ranking, authoritative sources. More than two inbound links per month shows we’re building relationships, while one to three inbound links from unaffiliated third-party sources indicates rising brand awareness. |
| Increase Social Media Engagement | Engagement, Sales Support, Brand Awareness, Brand Loyalty | Considering that median social media engagement rates are well below 1%, targeting a greater than 3% engagement on posts is considered a stellar benchmark. Posts should reach 20% of the total audience. We aim for 5+ social media shares per week and 3+ relevant, positive comments per post. |
| Increase Number of Return Readers | Engagement, Sales Support, Brand Loyalty | Within six months of consistent publishing, you should see returning visitors increase by 5% or greater, with an average consumption of five pages per trip to your site. At least 16% of this returning traffic should be doing so to convert, and overall, 18% of your traffic should be repeat customers rather than newcomers. |
| Increase Qualified Lead Conversion Rate | Lead Generation, Sales Support | A 3-5% conversion rate is good news indeed. In real numbers, this percentage translates to 10+ conversions per month. Overall, we want your cost-per-acquisition to be over 10% lower than the average for your industry. |
Search Engine Ranking Position
Google is responsible for delivering 75% of all traffic to websites, and a much larger percentage to B2B websites specifically. Within the Google search results, the top five results get 67% of the clicks. And once you achieve top 5 positioning for six or more transactional keywords, you can expect an organic traffic increase of at least 15% over a 6 month period. That should add up to a noticeable number of new potential customers arriving at your.
Organic Traffic
SEO is the single biggest factor in lead generation, according to 57% of B2B businesses. Since the whole point of SEO-optimized content is to attract new potential customers, it’s a sensible benchmark for performance. When a high percentage of your overall traffic, 40% or more, is organic, you can be sure that your enterprise SEO techniques are effective (unless you’re doing an extraordinary amount of paid advertising).
Organic traffic is also an excellent leading indicator of sales, as the majority of global ecommerce lead traffic (35%) stems from organic search. By comparison, paid ads deliver just 4% of leads. This is because organic SEO traffic can be targeted based on the search intent of the keyword, delivering leads that are further along in the conversion funnel than more traditional forms of marketing.
Let’s take this one step further, into the sales process itself: the average organic search lead closes 14.6% of the time, compared to just 1.7% for outbound marketing leads like TV, radio, print ads, trade shows, cold calls, and unsolicited email. While there is undoubtedly a place for paid media and traditional marketing, they are comparatively expensive because their costs tend to increase steadily over time. On the other hand, content marketing delivers organic traffic for the price of your writers or outsourced team.
Number of Blog Visits
Less than a third of B2B companies actively maintain blogs—and yet, businesses with blogs generate 55% more website visits than those without. A rise in blog visits indicates that more new potential customers are discovering your brand. And when taken to the highest level, ongoing blog content production can lead to industry dominance.
Time Spent on Page
A high time on page demonstrates that your visitors are engaged and interested in what you have to say. When a potential customer decides to use their time reading your blog posts or landing pages, you can be assured that your content is high quality and stands out in your field. Conversely, if your time spent on site is low, it can be an indication that your pages aren’t reaching the right audience. You’ll want to revisit your keyword strategy and make sure that you’re targeting the right search terms.
High time spent on page also helps with your SERP: since 2017, Google has rewarded high levels of user engagement with higher page rankings.
Average Inbound Links Per Post
A high number of inbound links also indicates that your content is being seen and appreciated by others. In 2021, inbound backlinks carry the third-highest algorithm weight at 16%—just behind keywords used in meta title tags (21%) and consistent publication of high-quality content (25%).
Social Media Engagement
Social media remains the most-used B2B marketing strategy, employed by 83% of B2B businesses, with 66% of marketers saying their efforts pay off in new leads. Even more salient is this statistic: 84% of C-suite buyers say they’re directly influenced by social media. Just a single share can significantly expand your company’s reach.
Repurposing already created blog content on social media is a great way to get more value from already created content, and provides much greater returns than direct advertising. Facebook and Instagram charge $1 a day for impressions, $5 per day for clicks/likes/views, and $40 per day for offer claims. Cost Per Click ranges from 38 cents on Twitter to $5.26 on LinkedIn. By comparison, you pay nothing when a lead clicks on a repurposed blog link.
Return Readers
Blogs are an important part of the customer journey. At the top of the funnel, a person may be exploring your content for general information. Later, after they’ve looked around and are closer to making a purchase, they may be looking for more specific information to overcome obstacles and feel comfortable in choosing your brand. Since nearly half of all buyers view 3-5 pieces of content before engaging with a sales rep, looking at click-through rates and return rates after a person first views the blog is significant. Fully converted return readers are a healthy indicator of not only customer loyalty, but brand affinity as well.
Direct Lead Conversion Rate
How many people read your blog and immediately make a related purchase? The blog conversion rate is the most obvious way to see content working and generating ROI. The average conversion rate for a B2B content marketing campaign falls between .8% and 1.1%, so we aim to beat it by at least 3x. At the end of the day, this is what will justify your entire content marketing campaign, so invest in strategies to increase your conversion rates if they’re falling short.
When you track these important KPIs, you’ll also know whether the money you invested in a content marketing campaign was really worth it. You can invest more heavily in the strategies that are proven to work and reframe or get rid of any strategies that lower your ROI.
B2B Content Marketing Benchmarks Help Achieve ROI
Tracking and monitoring the right KPIs allows you to determine the ROI of a successful content marketing campaign, and know how to refocus a lagging one. Hitting the benchmarks mentioned here will be a challenging endeavor, but it’s not impossible with a dedicated team who understands SEO and your business. And if you’d like to know more about which KPIs we think will help your company achieve its goals, feel free to get in touch.
Further Reading
If you’d like more information on B2B lead generation and conversion statistics, we recommend the following reports: