Our analysts compiled five years of data from 160+ websites and calculated SEO conversion rate across multiple dimensions. The results are published below.
In this report, a conversion is defined as the generation of a marketing qualified contact (e-mail address or phone number) via one of several actions, including downloading a gated piece of content, signing up for a free trial, filling out a contact form, or calling.
If you have questions or wish to order a .pdf of this report, contact us here.
SEO Conversion Statistics 2023
The below statistics were a joint effort between our analysts and our account managers to curate the most interesting and usable from a large data set.
Average SEO Conversion Rates by Business Type
| Business Type | SEO Conversion Rate | Notes |
| All Industries | 2.4% | The conversion rate is calculated based on a mixture of content types, approximately 74% educational blog articles, 21% sales-oriented landing pages, and 5% high-level reports. The industries we surveyed are all listed here. |
| Services Businesses | 2.7% | This data set is fairly skewed by managed services, custom software development, financial services, and legal services, all of which had conversion rates >3%. |
| SaaS | 1.9% | SaaS companies were further divided into B2B and B2C. The SEO conversion rate for B2B companies was 1.1% and B2C was 2.5%. |
| eCommerce | 1.6% | B2C eCommerce sites convert from SEO at an average of 1.3%, while B2B eCommerce SEO conversion skews a bit higher, at 1.85%. Higher-priced eCommerce (>$1,000 CLV) converts higher, at 2.3%, but at lower volume due to the highly specific keyword targeting of its SEO pages). |
| Offline Businesses | 2.9% | SaaS companies were further divided into B2B and B2C. The SEO conversion rate for B2B companies was 1.1% and B2C was 2.5%. |
Average SEO Conversion Rate by Page Type
| Page Type | SEO Conversion Rate | Notes |
| Blog Article | 2.3% | The data used in this calculation is skewed to higher quality articles, i.e. thought leadership posts. Standard content marketing posts tend to convert at 1% or less. |
| Landing Page | 2.4% | A landing page is a static, non-blog website page linked from a header or footer menu. It is typically more sales-oriented. This average is skewed upwards by Product, Service, and Application landing pages, which have much higher conversion rates than location and industry pages. |
| White Paper | 4.6% | White papers fare particularly well for high-end products and services with longer sales cycles. Their conversions occur over a greater length of time, typically 6-12 months. |
| Annual Industry Report | 4.8% | Annual industry reports are perceived as only being created by industry leaders, creating higher conversion rates among prospective customers attracted to the reports via SEO. |
| Webinar | 1.3% | While SEO isn’t the primary channel through which webinar visitors convert (that distinction goes to e-mail marketing), when highly targeted, it converts fairly well. |
Average SEO Conversion Rate by Customer Lifetime Value (CLV / LTV)
| Customer Lifetime Value (CLV / LTV) | SEO Conversion Rate | Notes |
| < $1,000 | 1.5% | Most businesses in this category are in higher-volume B2C industries. As a result, their websites receive a great deal of traffic, but will convert customers at a lower rate due to the difficulty in effective targeting. |
| $1,000–$10,000 | 1.8% | The number of potential customers decreases as the average customer CLV increases, allowing for better targeting. Careful keyword selection allows better visitor targeting, leading to higher conversion rates. |
| $10,000–$100,000 | 2.1% | Targeting improves further as we move into these higher priced, almost exclusively B2B industries. Many of these businesses are also in more traditional industries that primarily transact by purchase order, and as discussed above, the ones who do invest in SEO bring up the overall average. |
| $100,000+ | 1.6% | Although targeting remains high at this level, a greater proportion of visitors can no longer afford the product or service, and visit the website with no transactional intent. |
Full-Funnel Conversion Rate for SEO
Full funnel conversion rate is the percentage of visitors from a channel—in this case SEO—that convert on a website.
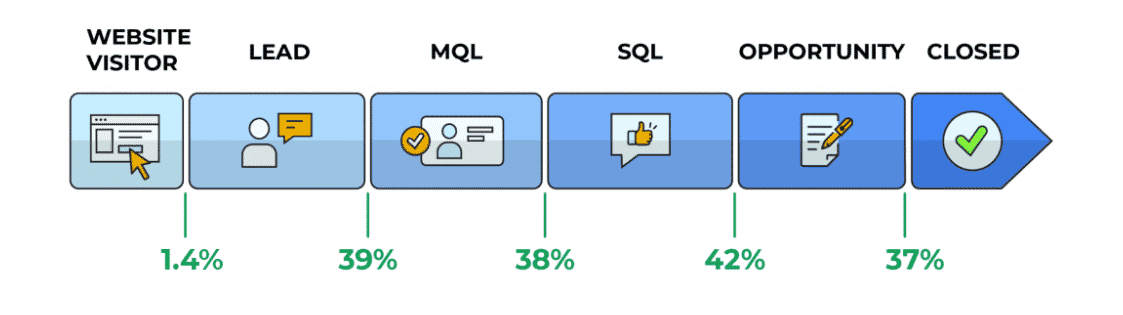 Full Funnel Conversion Rate for SEO = 0.032% or 1 in 3,100 visitors
Improving SEO Conversion Rate
By comparing your own website to the averages above, you may determine if you need to invest in conversion rate optimization for your own website. In its simplest form, this involves site-wide updates to ensure that your website is secure, responsive, and mobile-friendly. Navigation should be intuitive for visitors, with your highest conversion pages (such as service and product landing pages) easily accessible in the top-level menu. Finally, include a clear call-to-action on each page and use formatting, images, and other visual elements to both highlight this CTA and keep visitors engaged.
Further optimization will depend on page type: each page’s tone, writing style, and content should be crafted to match a potential visitor’s search intent and a well-designed landing page will be very different from a case study or white paper. We recently wrote detailed recommendations on how to increase conversion rates for each page, and these can be found in our report on Average SEO Conversion Rate by Page Type.
A simple option for many companies will be to outsource the conversion optimization process and future content production to an SEO agency. A skilled agency will not only resolve any issues on existing pages on your website, but also architect a comprehensive keyword strategy that includes creating new pages that satisfy the search intent of hundreds of high-conversion, transactional keywords. Over time, this will increase both your website’s overall conversion rates and the lead quality represented by those conversions, making your website an automatic lead generation system. If you’d like to learn more about working with an SEO agency, reach out here.
Further Reading
If you’d like to learn more about conversion statistics, see our detailed reports below: