This compendium of Conversion Rate Optimization (CRO) statistics comes from data collected between 2016 and 2021 from 86 clients of our marketing agency.
Here is the makeup of our dataset so that you can determine how representative it is for a company like yours:
- Business Type: 73% B2B; 21% B2C; 6% mixed B2B/B2C
- Business Size: 26% Small Business (<$10M revenue); 49% SMB ($10M-$50M revenue); 16% Midsize ($50M-$1B revenue); 9% Enterprise ($1B+)
- Audience Type: 21% Consumer; 24% Small Business; 14% SMB; 21% Middle Market; 20% Enterprise
- Industry: 16% Real Estate, 19% B2B SaaS, 12% Financial / Fintech, 11% Industrial IoT, 11% PCB Design & Manufacturing, 8% Medical Device, 7% Biotech, 5% Construction, and 11% other industries with under 2% representation.
The statistical categories we’ve chosen to segment or data by are:
- Traffic-to-Lead Conversion Rate by Channel
- Conversion Rate by Call-to-Action (CTA) Type
- Highest Converting Conversion Funnels
Traffic-to-Lead Conversion Rate by Channel
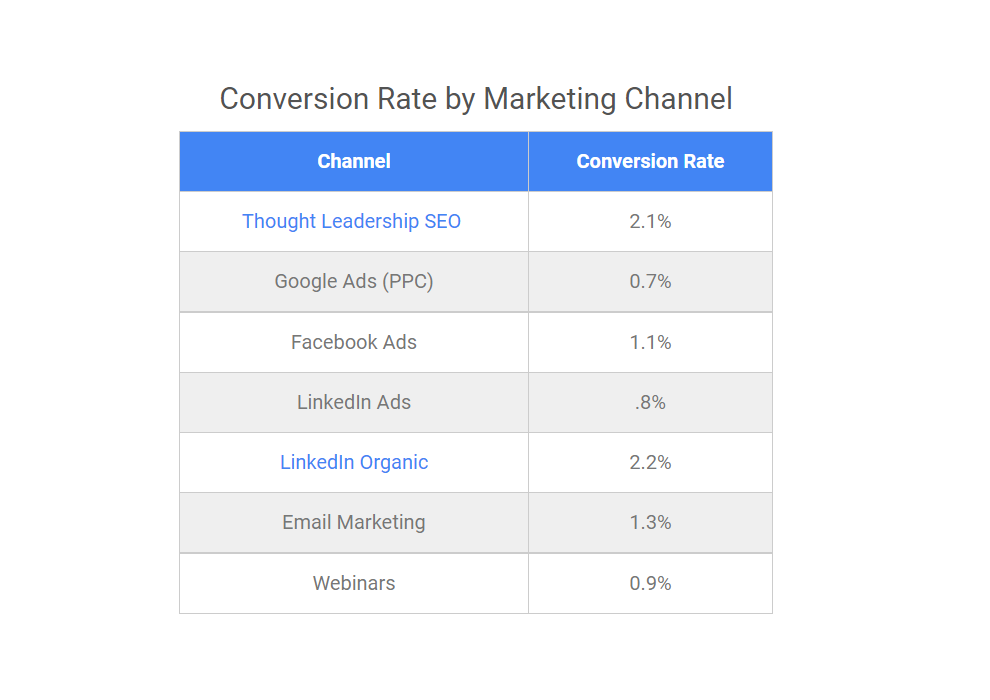
Below are the conversion rates companies in our data set saw, segment by marketing channel. In this context, conversion rate is defined as the percentage of website visitors that converted into a non-spam lead (one step prior to becoming an MQL).
Conversion Rate by Marketing Channel
| Channel | Conversion Rate |
| Thought Leadership SEO | 2.1% |
| Google Ads (PPC) | 0.7% |
| Facebook Ads | 1.1% |
| LinkedIn Ads | .8% |
| LinkedIn Organic | 2.2% |
| Email Marketing | 1.3% |
| Webinars | 0.9% |
Conversion Rate by CTA
In the following table, we share average conversion rate for the most common call-to-action (CTA) styles and goals / actions.
Conversion Rate by CTA Style
| CTA Style | Conversion Rate |
| Persistent Header | .2% |
| Screen takeover | 2.4% |
| Side of Page | .7% |
| Middle of Page | .8% |
| End of article | .5% |
Conversion Rate by CTA Goal
| CTA Type | Conversion Rate |
| Newsletter Subscribe | .8% |
| White Paper Download | 1.6% |
| Free Trial / Demo | .9% |
| Contact Sales | .6% |
Highest Converting Conversion Funnels
Below, we share the highest conversion rate funnels for both organic and inorganic channels.
Top 5 Organic Conversion Funnels by Conversion Rate
| Funnel | Conversion Rate | |
| 1 | Service Landing Page → Features Landing Page → Lead | 1.5% |
| 2 | Problem/Solution Blog Post → Service Landing Page → Lead | 1.4% |
| 3 | Industry Landing Page → About Page → Services Page → Lead | 1.0% |
| 4 | Blog Article → White Paper Download | 1.6% |
| 5 | Blog Article → Blog Article → Case Study → Newsletter Signup | 1.1% |
Top 5 Inorganic Conversion Funnels by Conversion Rate
| Funnel | Conversion Rate | |
| 1 | Google Ad → Service Page → Lead | 1.1% |
| 2 | Google Ad → Product Page → Purchase | 0.9% |
| 3 | LinkedIn Ad → Blog Entry → About Page → Lead | 0.7% |
| 4 | Google Ad → Blog Entry → Service Page → Lead | 0.6% |
| 5 | Facebook Ad → Product Page → Purchase | 0.5% |
Next Steps & Further Reading
We hope this compendium helps you make more informed decisions around your CRO and broader marketing investments. If you would like to order a pdf copy of this report or contact our firm, click here.
Also, if you’ve found this compendium useful, you may be interested in our other reports on conversion rate statistics: