Properly assessing the efficacy of a digital marketing campaign requires clear KPIs and benchmarking. In our 12 years of running digital marketing campaign in a variety of industries, we’ve found the following five metrics to be the most useful indicators of success:
- Conversion Rate
- Average Session Duration
- Engagement Rate
- % Change in Organic Traffic
- Clickthrough Rate
Below, we (a) provide digital marketing benchmarks for each metric listed above, segmented by industry, (b) explain what each tells you about your campaign, and (c) offer solutions to improve should one be lagging.
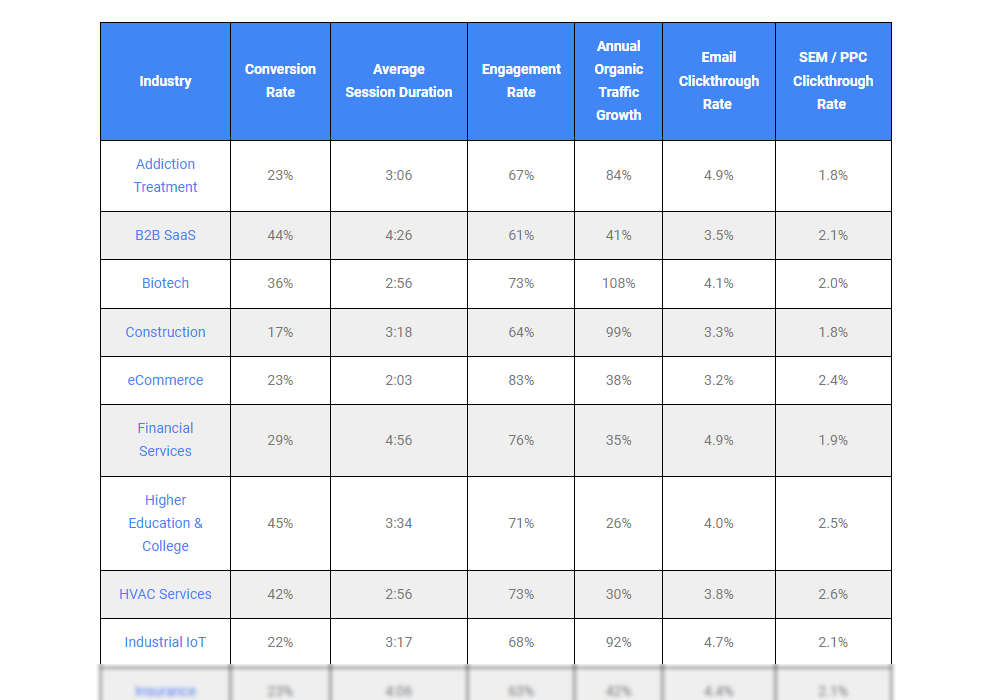
Digital Marketing Benchmarks by Industry
| Industry | Conversion Rate | Average Session Duration | Engagement Rate | Annual Organic Traffic Growth | Email Clickthrough Rate | SEM / PPC Clickthrough Rate |
| Addiction Treatment | 23% | 3:06 | 67% | 84% | 4.9% | 1.8% |
| B2B SaaS | 39% | 4:26 | 61% | 41% | 3.5% | 2.1% |
| Biotech | 36% | 2:56 | 73% | 108% | 4.1% | 2.0% |
| Construction | 17% | 3:18 | 64% | 99% | 3.3% | 1.8% |
| eCommerce | 23% | 2:03 | 83% | 38% | 3.2% | 2.4% |
| Financial Services | 29% | 4:56 | 76% | 35% | 4.9% | 1.9% |
| Higher Education & College | 45% | 3:34 | 71% | 26% | 4.0% | 2.5% |
| HVAC Services | 42% | 2:56 | 73% | 30% | 3.8% | 2.6% |
| Industrial IoT | 22% | 3:17 | 68% | 92% | 4.7% | 2.1% |
| Insurance | 23% | 4:06 | 63% | 42% | 4.4% | 2.1% |
| IT & Managed Services | 25% | 4:16 | 64% | 45% | 3.4% | 1.9% |
| Legal Services | 32% | 3:02 | 79% | 21% | 3.9% | 1.7% |
| Manufacturing | 26% | 3:37 | 68% | 37% | 4.3% | 1.9% |
| Medical Device | 24% | 3:58 | 65% | 40% | 3.6% | 2.3% |
| Oil & Gas | 32% | 4:13 | 58% | 55% | 3.4% | 2.0% |
| PCB Design & Manufacturing | 42% | 4:18 | 63% | 29% | 5.3% | 2.5% |
| Pharmaceutical | 41% | 3:47 | 64% | 22% | 3.3% | 1.8% |
| Real Estate | 27% | 3:52 | 52% | 31% | 4.9% | 1.9% |
| Solar Energy | 45% | 2:56 | 73% | 30% | 4.2% | 2.2% |
*SEO CTRs are highly dependent on ranking position, and benchmarks can be found here.
For other relevant digital marketing benchmarks, see our reports on:
- Conversion Rate by Channel
- B2B Content Marketing Benchmarks
- SEO Benchmarks by Industry
- Customer Acquisition Cost (CAC) by Industry and Channel
- Digital Marketing ROI Statistics
- LinkedIn Organic Benchmarks & ROI
Next, we’ll elaborate on each metric listed in the table above, offering a definition, formula, and advice for improving poor performance.
Conversion Rate
 Conversion rate records the percentage of users who complete a specific engagement action (for example, filling out a contact form). Combined with engagement rate, this metric is an excellent tool to measure the effectiveness of your website’s content.
If your conversion rates are low, remedy it by:
- Learning more about your audience. Understanding who your desired audience is and how to reach them is the first step in boosting conversion rates.
- Creating content that keeps the reader’s attention. Conversion is all about earning your visitor’s attention throughout the page, from the top of the page down to the CTA.
- Maintain user momentum with graphics and white space. Audiences are inundated with information, and their attention spans are short. Pages that consist only of long, visually unappealing paragraphs will turn away visitors before they have a chance to convert.
In addition to this overall conversion rate, you can dig even further into your website’s visitor flow by also tracking microconversions. These are smaller actions, such as downloading an image or visiting a second page that demonstrate interest but not as much as a full conversion. Data on microconversions allow you to determine exactly where a page may be losing visitor attention, and adjust accordingly.
Average Session Duration
 Average session duration makes up one half of engagement in Google’s algorithm. A long average session duration means you’ve accurately identified your visitors’ needs, captured their interest, and offered straightforward routes for them to continue navigating the website.
A short average session time often occurs when the same content is frequently recycled or does not resonate with the intended audience. Businesses should create a blog or landing page for each product, service, industry, and customer type to optimize engagement.
Engagement Rate
 Engagement rate is what it sounds like: a measure of how engaged your visitors are with the content on your website. This metric can be found in Google Analytics 4, which defines an engaged session as one where the visitor does any of the following:
- Stayed on the page for at least 10 seconds
- Viewed multiple pages
- Triggered a conversion event
If you’ve determined that your engagement rates are not hitting the digital marketing benchmarks listed above this is an indication that:
- Your written content fails to pique readers’ interest
- Your website’s navigation and UX needs improvement
- Your content is visually unappealing, whether due to unengaging graphics, or a lack of skimmable formatting, or
- You target keywords that draw the wrong customer type (whether you’re using PPC, SEO, or both)
Annual Organic Traffic Growth
 Percent change in organic traffic monitors year-to-year changes in website visitors from unpaid sources, and is an overall indication of performance for your organic marketing efforts. You should also monitor your month-over-month traffic, but expect more variance due to seasonal fluctuations and a smaller sample size. Annual progress allows you to control for these factors and determine the health of your campaigns long-term.
Should your organic traffic growth fail to meet your goals, you should:
- Ensure your SEO campaign uses a Hub & Spoke approach that prioritizes search intent analysis.
- Update your website with original content at least twice a week to take advantage of the News Website bonus
- Fix any technical issues that prevent your site from ranking more highly on Google, losing potential visitors as a result
Clickthrough Rate
 Click-through rate (CTR) is the percentage of impressions (someone who sees your search result, PPC ad, or email) that result in a visitor clicking through to your website, and is one of the most crucial metrics to track for visitor acquisition.
CTRs are highly dependent on the channel used. The most commonly tracked are SEO, email, and PPC. As mentioned above SEO CTRs are highly ranking position dependent, we provide only email and PPC CTRs in our above benchmarks.
Email Clickthrough Rate
Your email CTR is the percentage of recipients who clicked on one or more links in your email, divided by the number of total successful deliveries. To improve a low email CTR, you should examine:
- The design. Each email should have a pleasing and inviting appearance, and its structure should make the reader’s next move clear and straightforward.
- The frequency. Many email campaigns make the mistake of sending too many emails, resulting in recipients ignoring each message. We’ve also found that an optimal frequency for B2B email campaigns is lower than for B2C campaigns.
- The content. Ensure that the content is to the point and relevant to each recipient. In addition, segmenting your mailing lists will improve your ability to provide useful information, raising your CTRs.
- The Call-to-Action (CTA). Your CTA should be clear and concise, providing actionable next steps for your reader to follow.
PPC Clickthrough Rate
For PPC, the CTR is the number of clicks an ad receives divided by the total number of people who see the ad. A low PPC clickthrough rate may mean you need to:
- Improve your headline. You have a very limited space to convince searchers to click on your ad instead of one of the organic search results. Your headline is the first thing they see and needs to speak directly to their needs.
- Refine your keyword targeting. If your ads are being shown to the wrong audience, it doesn’t matter how well crafted your headline is. Just like with SEO campaigns, you must analyze the search intent of each keyword you target in PPC.
Improving Your Digital Marketing Campaign’s Benchmarks
We hope these benchmarks can assist you in analyzing your digital marketing strategy’s performance, whether you’re implementing it internally or outsourcing it to an industry expert. We’d be happy to speak with you if you’re searching for a means to develop a campaign that can outperform the industry benchmarks shown above.
If you’d like to discuss working together on a digital marketing campaign, you can contact us here.