KPIs are crucial for understanding the performance of digital marketing campaigns, but the sheer quantity of data available makes it difficult for marketers to hone in on which metrics really matter. In this guide, we’ve divided our discussion into 4 categories. We discuss general metrics & KPIs, which are important for any digital marketing campaign, as well as KPIs for each of the three most popular digital marketing channels: PPC, SEO, and email.
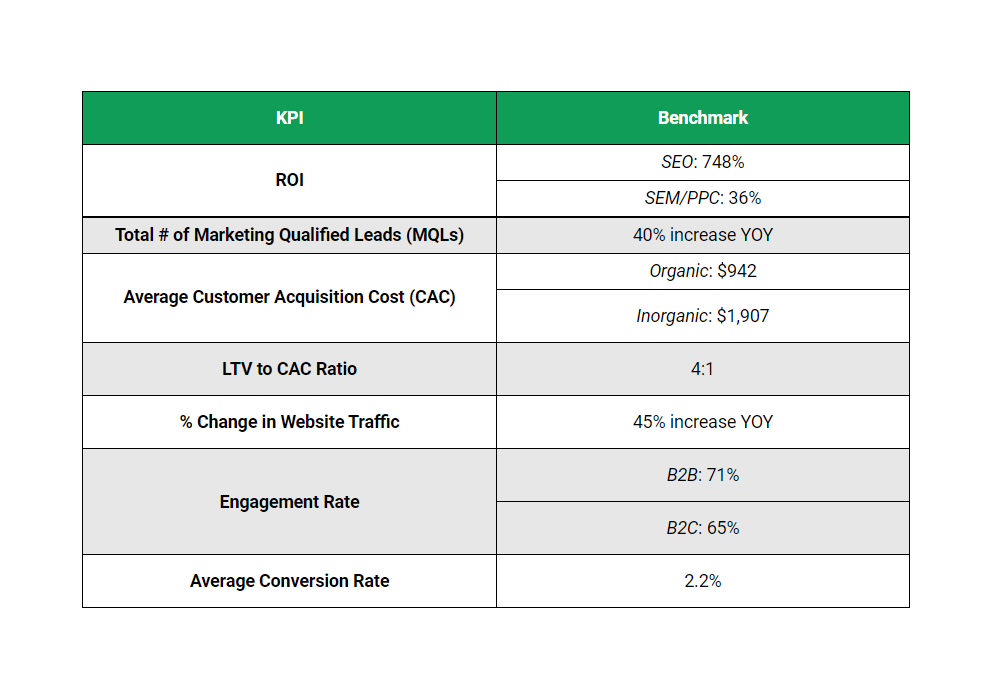
KPIs are most meaningful when paired with a benchmark for success. In the table below, you’ll find KPIs linked to their corresponding benchmark. All data comes from our pool of 170+ digital marketing clients:
| KPI | Benchmark |
| General Digital Marketing Metrics & KPIs | |
| ROI | SEO: 748% |
| SEM/PPC: 36% | |
| Email: 86% | |
| Total # of Marketing Qualified Leads (MQLs) | 40% increase YOY |
| Customer Acquisition Cost (CAC) | Organic: $942 |
| Paid: $1,907 | |
| LTV to CAC Ratio | 4:1 |
| Engagement Rate | B2B: 71% |
| B2C: 65% | |
| Average Visitor to Lead Conversion Rate | 2.2% |
| Clickthrough Rate (CTR) | SEO: 9.8% (Average for 1st page results, highly dependent on position) |
| SEM/PPC: 2.0% | |
| Email: 4.0% | |
| Pages Per Session | 2.2 |
| Average Session Duration | 3:36 |
| Paid Marketing Metrics & KPIs | |
| Cost Per Conversion (CPC) | Varies by Industry |
| Return on Ad Spend (ROAS) | 1.55 (Varies by Industry) |
| Organic Marketing Metrics & KPIs | |
| Organic Traffic | +45% increase YOY |
| # of Autofill, Transactional Keywords on Page 1 | +91% increase YOY |
| Email Marketing Metrics & KPIs | |
| Open Rate | 23% |
| Clickthrough Rate | 4.0% |
The next sections expand upon each of the digital marketing KPIs and explain what they reveal about your digital marketing campaign.
General Digital Marketing Metrics & KPIs
While the benchmarks will vary depending on specific channel chosen, the metrics below are applicable to any digital marketing campaign.
ROI
| ROI | |
| Benchmark | SEO: 748% |
| SEM/PPC: 36% | |
| Email: 86% | |
Your digital marketing campaign’s ultimate measure of success is ROI, which compares the amount of money spent to the overall profit. ROI is not a benchmarking statistic in the same way that the other KPIs are, rather, it provides a more holistic view of your campaign.
This makes ROI both your most significant and least important KPI. On one hand, it provides a single statistic by which you can assess the entire health of your campaign effort. On the other, there is no one-size-fits-all approach to increasing ROI if you are already investing in high ROI channels.
As a result, to address a low ROI you will need to:
- Compare additional KPIs (see below) to benchmarks to find any underperforming metrics
- Determine potential reasons those KPIs are underperforming, and implement a strategy to address those reasons
- Reevaluate ROI after three months, and repeat as needed.
Total # of Marketing Qualified Leads (MQLs)
| Total # of MQLs | |
| Benchmark | 40% increase YOY |
MQLs are leads that demonstrate a direct interest in your company’s products or services and originate from the intended target industry. They are a far more accurate predictor of a campaign’s success than counting total visitors, clickthroughs, leads, or other higher-funnel metrics because they demonstrate if your digital marketing strategy is reaching actual prospects, and the demographics of those prospects help you determine which markets you’re trying to attract.
MQLs are much like ROI in that they don’t provide much information on their own, and also offer a general view of campaign success. However, they are often more accessible to marketing teams than ROI tracking, and are more responsive to campaign adjustments. As with ROI, increasing your total MQLs entails examining your other, more granular KPIs and addressing issues at a lower level.
Customer Acquisition Cost (CAC)
| Average CAC | |
| Benchmark | Organic: $942 |
| Paid: $1,907 | |
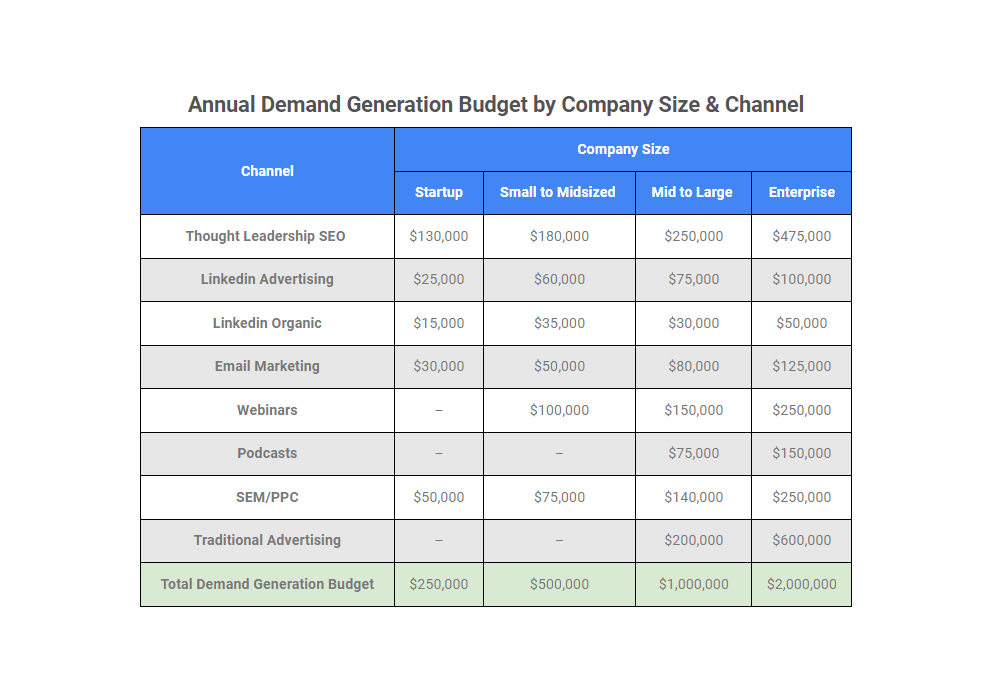
CAC refers to the average cost of acquiring each new customer. It shows how sustainable your marketing strategy is. The best way to lower your customer acquisition costs is to invest in organic channels, which have much lower CACs than paid channels because they’re scalable one-time investments as opposed to ongoing ones.
The Marketing Channels with the Lowest Average CAC
| Channel | Average CAC |
| LinkedIn Organic | $658 |
| Thought Leadership | $647 |
| Webinars | $603 |
| Public Speaking | $518 |
| Email Marketing | $510 |
The tradeoff is that these channels are generally slower than paid channels, and require a longer lead time before they begin producing a return. As a result, most companies will still use paid channels like PPC to provide short-term lead generation.
LTV to CAC Ratio
| LTV to CAC Ratio | |
| Benchmark | 4:1 |
Your LTV to CAC Ratio contrasts the lifetime profit a client generates with the cost of acquiring them. A low LTV to CAC ratio combined with high CACs indicates your firm is overpaying to attract customers. However, if the ratio is extraordinarily high, it usually means your organization is not spending enough on marketing efforts and missing out on growth chances. While some firms target 3:1 for their ratio, we’ve found
You can improve your LTV to CAC ratio by lessening your CACs (see above) or increasing your average LTV by refining your targeting to reach more profitable consumers.
Engagement Rate
| Engagement Rate | |
| Benchmark | B2B: 65% |
| B2C: 71% | |
The engagement rate is a percentage that represents the proportion of engaged sessions to total sessions. An engaged session, as defined in Google Analytics 4, is one in which the visitor accomplishes one or more of the following:
- Reviewed several pages
- Spent at least 10 seconds on one page.
- Set off a “conversion event,” which signals that visitors completed key, pre-defined business actions.
If your engagement rates are too low, there are several possible causes, including:
- Content that fails to pique readers’ curiosity
- Ineffective keyword targeting, resulting in attracting the wrong type of customer
- The user experience and navigation are inconsistent
- Uninteresting graphics, charts, and graphs
Average Visitor to Lead Conversion Rate
| Average Conversion Rate | |
| Benchmark | 2.2% |
Your conversion rate is calculated by dividing the total number of users who perform a conversion event (for example, by filling out a contact form) by your total number of website visitors. Tracking conversion rates across your digital marketing channels reveals which channels are most effective for advertising a given product or service, allowing you to make more informed strategic decisions.
If your conversion rates are low, invest in the following optimization best practices:
- Gain a better understanding of your target market. Understanding the various types of visitors to your site is the first step toward increasing conversion rates.
- Create thought leadership content that maintains the reader’s interest. Your pages must earn your customers’ attention from the top of the page until all the way down to the CTA.
- Use images and white space to keep the user’s attention. Today’s audiences are bombarded with digital content and have short attention spans. Long, visually unpleasant paragraphs will put readers off.
- Track on micro-conversions. Getting even more granular with your metrics allows you to find and address issues on each page, taking you from a few high-converting pages to a comprehensive high-converting system.
Clickthrough Rate (CTR)
| Average Clickthrough Rate | |
| Benchmark | SEO: 9.8% (Average for 1st page results, highly dependent on position) |
| SEM/PPC: 2.0% | |
| Email: 4.0% | |
Clickthrough rate refers to the percentage of people who click on your ad, search result, or email after seeing it. You may find your clickthrough rates through Google Ads for PPC, Google Search Console for SEO, and through a marketing automation platform such as Hubspot for email campaigns.
CTR benchmarks and improvement strategies are both highly channel dependent. The best way to improve your CTRs for each channel are below:
- PPC: Low CTRs are frequently the result of poor targeting that presents uninterested searchers with your ads. Ensure that your ad campaigns target highly transactional keywords.
- SEO: The #1 factor that impacts clickthrough rate is ranking position. Publishing high quality content that answers search intent, and then regularly updating that content according to the Corpus of Content model is the single best way to improve organic search CTRs.
- Email: A compelling subject line is one of the most important factors in email clickthrough rates, as a one will cause recipients to delete or archive emails without opening them first. Your emails should also be kept brief, including just enough information to entice a reader to click on a link to learn more on your website.
Pages Per Session
| Average Pages Per Session | |
| Benchmark | 2.2 |
Visiting more than one page on your website is a clear indicator of interest, whether that visitor came from an ad, a Google search, or an email. Each page also presents an opportunity for the visitor to spend time with your brand, gaining a deeper understanding of why your product or service is appropriate for their needs.
A low pages per session average can be improved by (a) including clear conversion paths for visitors to take when they want to learn more about your company, and (b) optimizing the UX of your website, as any friction a visitor experiences can cause them to leave immediately.
Average Session Duration
| Average Session Duration | |
| Benchmark | 3:36 |
As with pages per session, average session duration is an indicator of how well your website’s pages maintain visitor interest. Most visitors to your site are looking for an answer to a specific problem or pain point, and failing to find this answer will cause them to look for another source of information. To improve your session durations, keep in mind exactly why a visitor might be on your page—if they arrived through SEO or an ad on Google then make sure you understand their search intent; if they arrived through clicking on an email then tailor your page to follow up on your email’s CTA.
PPC Metrics & KPIs
Google wants marketers to rely on paid ads, and not only makes it easy for marketers to find their cost per conversion, but even allows them to set target ROAS or target CPC when placing bids. These two metrics are closely related, and we discuss each in detail below:
Cost Per Conversion (CPC)
| Average Cost Per Conversion | |
| Benchmark | Varies by Industry |
Cost per conversion is exactly what it sounds like: how much, on average, each conversion costs your company. This is calculated automatically in Google Ads provided you have appropriate conversion tracking set up (see Google’s guide here). In order to minimize your CPCs, you should target highly transactional keywords with your ads, as these are both lower competition and lead to higher conversion rates than bidding for ads on more general, research-oriented keywords.
Return on Ad Spend (ROAS)
| Average ROAS | |
| Benchmark | 1.55 (Varies by Industry) |
Another important metric to track for PPC campaigns is return on ad spend (ROAS). ROAS can be used as a campaign-specific stand-in for ROI, and the formula for determining ROAS is:
ROAS = Total Revenue from Campaign ÷ Campaign Spend
ROAS is a direct reflection of the profitability for the marketing campaign, and the best ways to improve it are: (a) target ads to high-revenue customer segments, (b) optimize conversion pathways to increase revenue for the same ad spend, and (c) implemented automated followups when applicable to increase overall close rates.
SEO Metrics & KPIs
The metrics you use to measure the success of an SEO campaign are broadly applicable across marketing channels and therefore primarily discussed above. Below, we’ll discuss the two metrics that are highly relevant to specifically SEO.
Organic Traffic
| Organic Traffic | |
| Benchmark | 45% increase YOY |
Annual Website Traffic measures how many users visit your website every year. Like ROI and total MQLs, your website traffic year over year is a general indicator of your campaign’s success. However, and unlike ROI, percent change in website traffic is not an indicator of the profit generated by your campaign. As a result, we caution against using it to gauge campaign success.
It’s not without its utility, however. Analyzing website traffic gives you a very general idea as to whether your internet presence is expanding, diminishing, or maintaining stagnant. Major changes in website traffic without accompanying website updates will also alert your SEO team to updates to Google’s algorithm.
# of Autofill, Transactional Keywords on Page 1
| # of Autofill, Transactional Keywords on Page 1 | |
| Benchmark | +91% increase YOY |
An autofill keyword is any keyword that appears in a list of 10 results when you start typing it into the Google search bar. Being included in such a list indicates that the keyword is highly searched, without the need to use a dedicated SEO tool like ahrefs. Following SEO best practices will naturally lead to more keywords ranking on page 1. Those best practices are:
- Use the Corpus of Content model to organize your SEO campaign
- Begin your keyword research with the Hub & Spoke strategy, targeting no more than 4-6 hubs
- Analyze search volume and intent to select high value keywords
- Match page types to keywords based on search intent
- For each keyword, create thought leadership that answers that keyword’s search intent
- Publish at least twice weekly for the News Website Bonus
- Implement analytics for lead tracking and attribution, and update regularly
Email Marketing Metrics & KPIs
Email campaigns are an important nurturing tool for warming leads. For your email marketing campaign to be successful, your messages must be engaging such that recipients actually read and act on them. The best metrics for determining how well you are meeting this mandate are the open and clickthrough rates. We’ve already discussed clickthrough rates above, so here we discuss only open rates in more detail.
Open Rate
| Average Open Rate | |
| Benchmark | 23% (across industries) |
Your email open rate is exactly what it sounds like: the percentage of email recipients that actually open your emails. You can find your open rates by running email campaigns through marketing automation software such as Hubspot—these will automatically include tracking methods such as magic pixels that trigger when an email is opened.
Low open rates are caused by two issues: low quality email lists and poor subject lines. Purchased email lists rarely result in good returns, instead use blog subscriptions, registration gated white paper downloads, and other microconversions to encourage actually interested visitors to leave their emails for future contact. Subject lines should convey the immediate value of reading further—if a recipient feels that they have little to gain, they will simply delete your emails.
Knowing How to Use KPIs to Measure Campaign Success
Analyzing KPIs is half art and half science, and they won’t necessarily provide you with the most accurate picture without in-house experience in analyzing these metrics. If you’re struggling with where to begin, it may be time to explore collaborating with an agency like ours to assist you in discovering and analyzing the essential digital marketing KPIs.
We have 12 years of experience working with clients across a wide variety of industries. Schedule a call if you’d like to learn more about our services.