In this article, I explore the key factors that go into valuing and selling a SaaS business. These perspectives come from my own experience selling a SaaS business as well as the experiences of dozens of other entrepreneurs I’ve interviewed. The data on current valuation multiples was sourced from third-party M&A databases between June 2022 and April 2023 (see sources).
| Table of Contents |
| Related: If you are exploring a sale, see our 2023 report on the Top M&A Advisory Firms in the US. |
SaaS Valuation Methodology
There are three broad areas that prospective buyers consider when valuing a SaaS business for a transaction, including:
- Financial Information: Your company’s revenue (typically expressed as ARR), profitability, and cash flow are the bottom line metrics used in valuing a SaaS business.
- Customer Metrics: Buyers will want to see that the company has a solid base of loyal customers who are likely to continue using your software in the long-term.
- Market Trends: Buyers are interested in both the macro trends of the SaaS market as well as the micro trends within the company’s niche or vertical.
SaaS Valuation Models
In M&A, companies are valued using a multiple of some key metric. The two most common metrics used to determine price for a SaaS business are:
- ARR – The company’s annual recurring revenue
- EBITDA – The company’s earnings before interest, taxation, depreciation, and amortization; basically the same as operating cash flow, except it takes interest and taxes into account.
While EBITDA is the industry standard in non-SaaS M&A, ARR has become the most common metric in SaaS M&A over the last decade or so. That said, both multiple types have properties that make them better suited for specific situations, as described below.
The ARR Valuation Model vs. the EBITDA Valuation Model for SaaS
| Annual Recurring Revenue (ARR) | EBITDA | |
| Formula | Revenue
= Sum of subscription revenue for the year + recurring revenue from add-ons and upgrades – Revenue lost from cancellations and downgrades that year. |
EBITDA = Net income + Interest + Taxes + Depreciation + Amortization |
| Pros | Demonstrates capacity for growth | Demonstrates profitability |
| Indicates potential for profitability if proper operational practices are implemented | Gives a truer picture of value for mature SaaS businesses with established product/market fits, sales teams, and reputations | |
| Provides a broad snapshot of business without getting bogged down by revenue recognition issues | Can offer clues into structural problems, including incorrect pricing models | |
| Cons | Doesn’t capture true profitability or cash flow | Doesn’t account for debt |
| Can hide operational issues | Ignores the common early-stage SaaS practice of reinvesting profits for growth | |
| Easily manipulated by recognizing revenue differently | Can be interpreted in multiple ways and thus manipulated | |
| Best For | SaaS businesses in their first 3-4 years | SaaS businesses with established presences in their market |
| Companies with complex pricing models | Companies who have figured out their pricing model and have high margins |
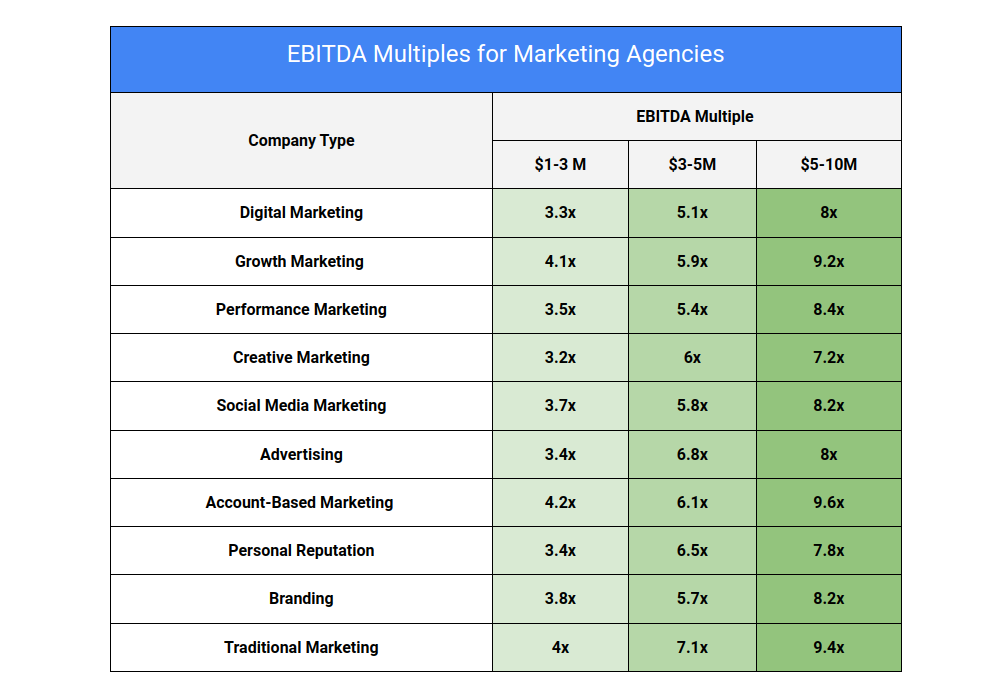
For small SaaS businesses that don’t subscribe to the hyper-growth model of burning cash to increase ARR, another metric some buyers use for valuation is a multiple on Seller’s Discretionary Earnings (SDE) – essentially, the money that is left over for the owner after all the business’s expenses are handled.
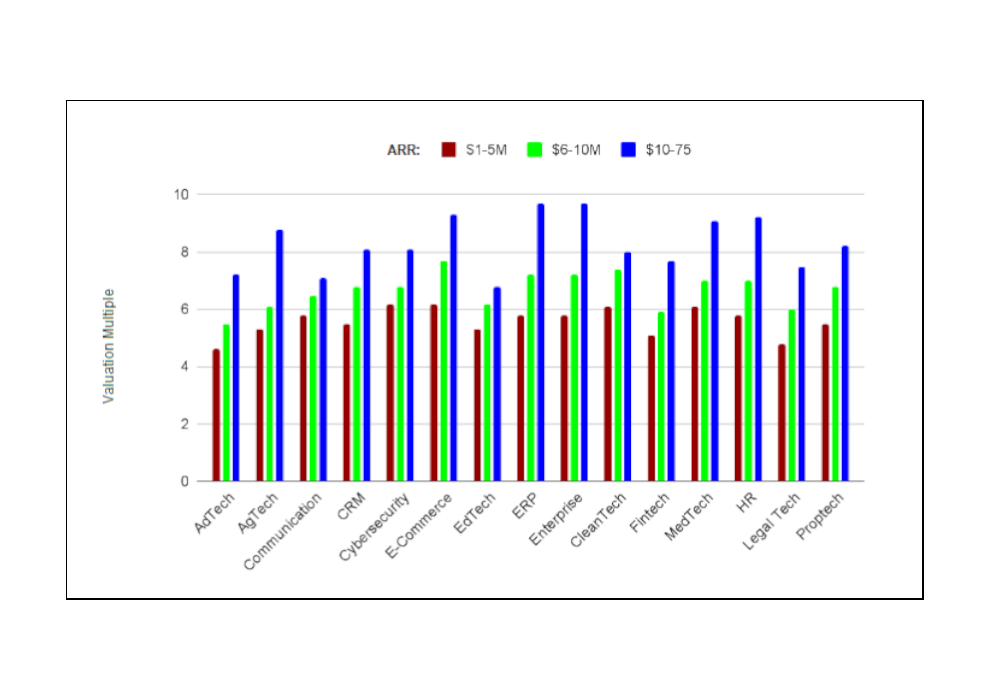
Below is a comparison of ARR Multiples for SaaS industries as of Q2 2023. It is broken down by ARR range. For the full report, click here.
The average ARR multiple that SaaS businesses receive from acquirers across all ranges is 6.6x.
ARR Multiples by SaaS Industry, 2023

Key Metrics & KPIs in SaaS M&A
The following section identifies and discusses the most common metrics acquirers look at when valuing a SaaS company. They include:
- Lifetime Value of a Customer (LTV)
- Customer Acquisition Cost (CAC)
- Churn Rate
- Debt-to-Equity Ratio
- Burn Multiple
- Hype Factor
- Future Proof Index (FPI)
While the first four metrics are standard items all acquirers will review, the last three are advanced metrics that only more sophisticated PE and venture firms will use.
| NOTE: While the valuation multiples listed above set the baseline price for a SaaS company, the factors below can adjust the price up or down up to ~20%, in my experience. |
Lifetime Value of a Customer (LTV)
LTV is the amount of revenue a customer provides the business over its lifetime. It is calculated by multiplying the revenue a customer generates over a given time period (e.g., month or year) by a customer’s average lifespan. Typically, you will also want to subtract the Cost of Goods Sold, which can be accomplished by multiplying the LTV by your Gross Profit Margin.
SaaS companies with high LTVs will be looked at favorably by acquirers because there is less reliance on constantly acquiring new customers in order to generate revenue, as well as a higher likelihood of customer satisfaction and referrals. Many acquirers will also look at the ratio of a company’s LTV to its CAC (see below).
Customer Acquisition Cost
Customer acquisition cost measures what it costs to gain a new customer in a repeatable way over a period of time (usually one year but sometimes broken down over a campaign period). It’s calculated by dividing the total dollars spent acquiring the customer in marketing and sales by the total number of new customers acquired.

CAC is a particularly important metric for acquirers of earlier-stage SaaS businesses since it predicts the ease or difficulty of growing the business. You can see the average CAC for various SaaS niches here.
Churn Rate
Churn measures how successfully a company retains users/subscribers over a given period of time (annually or quarterly). It is calculated by dividing the “churned” (i.e., “lost”) annual recurring revenue during the time period by the ARR at the start of the same time period, as depicted below:

For a simple example, a company that started 2022 with $100 but saw $25 of that lost over the course of the year would have a churn rate of 25%, since it lost a quarter of its revenue. Conversely, the same $100 company having only lost $4 of revenue would have an outstanding churn rate of just 4%.
As a general rule, SaaS companies should seek an average churn rate under the industry average of 10%. At this point, buyers are more likely to see that company as having a quality service and a reliable source of revenue.
Debt-to-Equity Ratio vs. Debt-to-Revenue Ratio
Debt-to-equity ratio measures the company’s financial leverage by comparing the amount of a company’s debts to the amount of its assets. It helps potential buyers understand how much risk they’d be taking on from a debt perspective by acquiring the company. A similar metric, debt-to-revenue ratio, compares the amount your business owes to the amount it earns in a given time period. The equations for both are below:
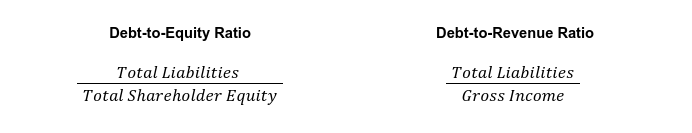
For a SaaS company to be attractive to acquirers, it should have significantly more in assets than debt. For example, a company with $5M in outstanding debt but with a total shareholder equity of $10M would have a debt-to-equity ratio of .5.
|
Debt-to-Equity Ratio Benchmarks
|
Debt-to-income ratio reflects similarly on a business’ reliance on debt, but uses income rather than total equity to measure its health. In the below table, you will find debt-to-income ratio benchmarks for a Series C SaaS business.
Debt-to-Revenue Ratio Benchmarks for Late-Stage SaaS
| Rating | Debt-to-Revenue Ratio |
| Outstanding | .20 |
| Great | .25 |
| Decent | .33 |
| Mediocre | .50 |
| Poor | 1 |
Burn Multiple
Burn multiple refers to the expertise with which a startup generates growth using their available capital. The metric is calculated by dividing the company’s “net burn,” which refers to how much money they spend – by their net new ARR.
If the net burn is higher than the new ARR (e.g., a company burns $2 to make $1) their burn multiple is 2, meaning they are losing twice as much as they gain. If the net burn is lower (e.g. the same company burning $.50 to make $1) their burn rate is .5, since they lose half as much as they gain.
Burn multiple is an essential metric in SaaS due to the sector’s high level of sunken investments and delayed timeline to profitability. With the exceptionally higher business lending rates of 2023 (~10% as of Q2) cash is more difficult to come by, so burn multiple is particularly scrutinized.
The table below provides general benchmarks for early-stage SaaS company burn multiples.
Burn Multiple Benchmarks for Series A SaaS
| Burn Multiple | Investor Perception |
| 0.25 – 0.5 | Outstanding |
| 0.5 – 1 | Good |
| 1 – 1.5 | Mediocre |
| 1.5 – 2 | Bad |
| 2+ | Terrible |
Hype Factor
Hype factor refers to the difference between outside investments in a company and the company’s actual ability to generate revenue. The hype factor formula is as follows:

Consider a SaaS company working with a VC firm to provide capital. In 2023, the firm invests $100, while the company generates $75. This would lead to a hype factor of 1.3, meaning that the company is close to matching its VC funding, indicating some level of stability for a startup. For reference, that same company generating only $25 would have a hype factor of 4, meaning that the company is not sustainable since it requires 4x as much outside capital as it can generate itself.
Hype factor is an important yet often overlooked metric in SaaS company valuations because so many SaaS businesses rely on outside funding, and in hot investing environments like 2014-2022, can over-rely on capital to the detriment of their core business.
Future-Proof Index (FPI)
Future proofing refers to the steps taken to ensure that a business can continue to grow while adapting to new challenges and opportunities resulting from technological innovation.
Future proofing is often presented as a purely qualitative concept, which makes measurement impossible. Future-Proof Index (FPI) was created to give SaaS owners a frame of reference for how prepared their company is to weather the innovation ahead.
The Future-Proof Index
| Metric | Scoring Criteria | Score Range |
| Flexibility |
A highly flexible company has gone through any of the following situations without seeing employee turnover greater than 15%:
|
1 – Very Inflexible
2 – Somewhat Inflexible 3 – Average 4 – Somewhat flexible 5 – Very flexible |
| Clarity of Purpose | A company with a strong clarity of purpose has had a consistent company mission, vision, and value statement during periods of major economic, cultural, regulatory, or leadership change. | 1 – No consistency
2 – Little consistency 3 – Moderate consistency 4 – Strong Consistency 5 – Full Consistency |
| Historical Financial Strength |
A SaaS company with a strong financial history has either:
|
1 – No HFS
2 – Minimal HFS 3 – Average HFS 4 – Good HFS 5 – Excellent HFS |
| Level of Debt |
SaaS companies with lower levels of debt have either:
|
1 – Extreme Debt
2 – Heavy Debt 3 – Moderate Debt 4 – Light Debt 5 – No Debt |
| Customer Loyalty |
A high degree of customer loyalty is indicated by an
|
1 – No Customer Loyalty
2 – Minimal Customer Loyalty 3 – Average Customer Loyalty 4 – Significant Customer Loyalty 5 – High Customer Loyalty |
| Total | The addition of all scores in the above rows. | # / 25 |
Once your total has been calculated, compare it against the spectrum presented below. Most SaaS companies typically score somewhere between 11-15:
Future Proof Index Scorecard

For reference, the following table demonstrates how 3 well-known companies score on the FPI.
Future Proof Index Examples
| Company | FPI Score | Explanation |
| The Walt Disney Company | 22 | Disney’s mission since its founding in 1923 has been to “entertain, inform, and inspire people around the globe through the power of unparalleled storytelling.” Despite its present size and scope, many forget that Disney was nearly bankrupt before its renaissance in the 1990s.
Since that time, Disney has adapted its business model, acquiring other family-friendly media companies such as 20th Century Fox, ESPN, and Marvel; however, they have also done a great deal of work reimagining their existing IPs through live action remakes, regular development of theme parks, and expansion into Broadway shows. |
| 18 | Google set out in 1998 to “organize the world’s information” and has stayed true to that mission for 25 years, advancing seamlessly from search to maps to mobile operating systems to cloud services. Further, it has stymied competition by investing in expensive data centers that give its products an enormous advantage in processing speed.
Where it has fallen short, however, is in preparing for the information discovery sea change that is Large Language Models (LLMs). It will suffer billions of dollars in lost market share at the hands of Microsoft’s ChatGPT over the next several years. Google had access to its own LLM but kept it under wraps too long, allowing its competitor to get a first mover advantage and its strength as market leader to waver. |
|
| Netflix | 9 | Netflix was the first major streaming service, debuting its streaming product in 2007. The company was paradigm-changing, leading to an incredible run until early 2022, when their competition caught up to them. Since then, Netflix has seen constant decline in market share. Currently, they hold ~20% of the streaming market, down from a peak of 71%, while their competitors, e.g. Prime Video, Disney+, HBO Max, have all steadily increased. Surveys show that content is the problem: While Netflix focuses on original shows, other services have focused on building extensive libraries of existing, popular IP. Moreover, analysts have decried that Netflix’s core values appear to change approximately every two years, showing a lack of brand consistency that future-proof companies require. Their financial management has also been questionable – with a debt to equity ratio of .69 on a debt of 14.8B as of 2023, they suffer from a bloated budget and high levels of debt. |
Post-Valuation: Taking The Next Step
Creating an expectation around the value of your SaaS business cannot be underestimated. Often the difference between a deal being made or not is the difference between expectations and reality. I hope this article has given you a sense of where your company falls in the pricing spectrum.
When I’ve asked entrepreneurs who exited their SaaS businesses what they wish they knew before they started the M&A process, I tend to hear that they wish they understood how slippery the deal process can be, and how that naivete leads to real-world problems when they’re in their earnout period. I hear that promises made by the PE firm or strategic buyer ended up being broken, not usually formally but technically, due to something as bizarre as a definitional shift in the word EBITDA, or an oversight in the fine print around payment terms. This is why it’s essential to work with an M&A advisory firm. (See our list of the top M&A advisory firms.)
I also encourage you to speak to other SaaS owners who have exited and ask them candidly about their experience. Selling a business is life changing, but ideally that change remains in the positive realm. The post-deal period is typically several years of prime life, and you want to go into that with a clear understanding of the deal process.
If you have any questions about selling a SaaS business, I am always happy to talk to fellow owners and share my experience. You can reach me through the author box below or the contact page of this site.
- SaaS Valuations: How to Value a SaaS Business in 2023 (FE International)
- 4 Key Metrics to Calculate a Private SaaS Valuation (Flow Capital)
- How to sell SaaS: a model for main factors of marketing and selling software-as-a-service (Lecture Notes in Business Information Processing)
- How Do Corporate Valuation Methods Reflect the Stock Price Value of SaaS Software Firms? (ISM Journal of International Business)
- Do We Know How to Price SaaS: A Multi-Vocal Literature Review (ACM Digital Library)
- From Impossible to Inevitable: How SaaS and Other Hyper-growth Companies Create Predictable Revenue (Aaron Ross & Jason Lemkin)
- How to Value a SaaS Business (The Bloom Group)
- The Top Five Metrics Driving SaaS Company Valuations (Forbes)
- SaaS and the Rule of 40: Keys to the critical value creation metric (McKinsey)
- How to Value a SaaS Business (Moore & Stanley)