To make the most of your B2B content marketing efforts, you need to understand (1) which metrics would best help you measure the success of your campaign; (2) which metrics are actually available to you; and (3) what each metric tells you about your campaign. It’s also important to understand how to troubleshoot if your campaign underperforms those metrics.
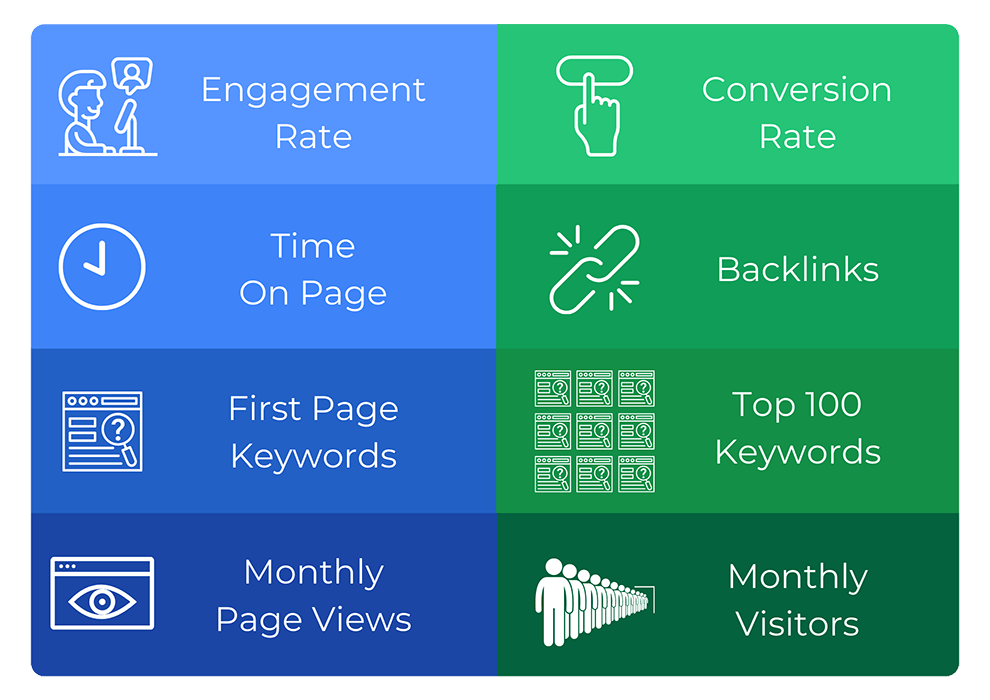
Let’s start with the ideal metrics for measuring a B2B content marketing campaign:
- Engagement rate
- Conversion rate
- Time on page
- # of first page keywords
- # of top 100 keywords
- Backlinks
- Total monthly page views
- Total monthly website visitors
Given that the overall goal of marketing is to produce conversions (of customers, employees, or partners), these metrics are all leading indicators in that they indicate that your content marketing is doing its job. Content marketing is typically measured in this way to allow for a more granular evaluation of the campaign, even though the high level goal of all lead generation channels is conversion.
Once you know how you’d ideally measure your content marketing, you can turn to what you actually can measure given your current systems and capabilities. To the extent that some ideal metrics aren’t being tracked in your company, it’s incumbent on marketing leadership to put a system in place to change that.
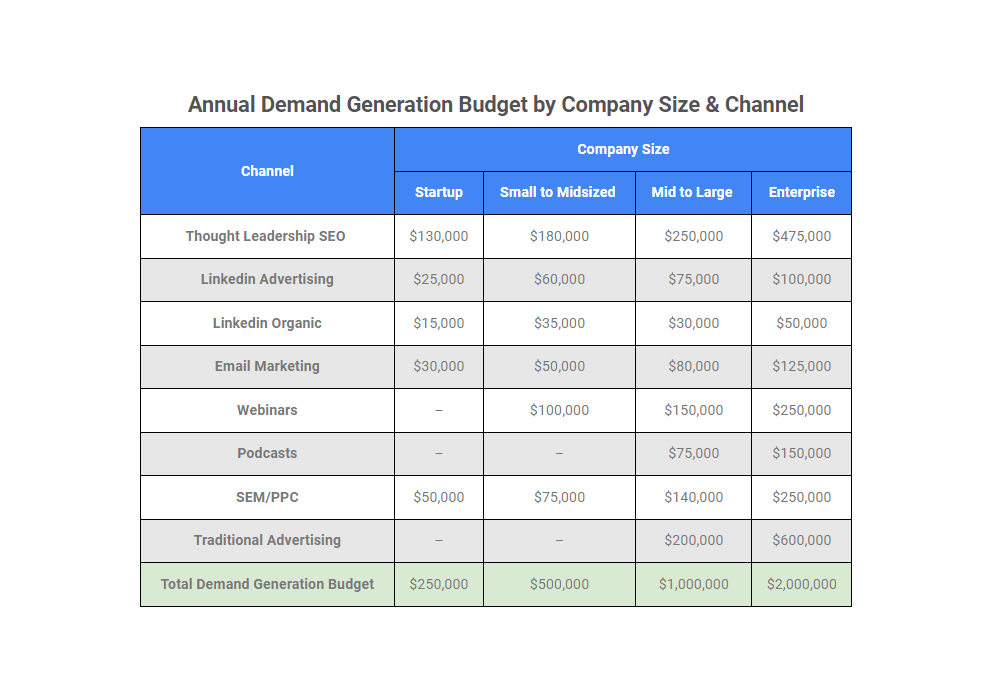
Below are the ideal B2B content marketing metrics, as well as a benchmark of success taken from 12 years of conducting B2B content marketing campaigns. After the table, we explain each metric in more detail.
B2B Content Marketing Metrics: What Success Looks Like
| Metric | Success Benchmark |
| Engagement rate | 63% or higher |
| Conversion rate | 2–5%, depending on industry and page type |
| Time On Page | 37 seconds on average. Below 20 seconds is problematic. 2-3 minutes is outstanding. |
| # of First Page Keywords | 10% growth year-over-year in total first page keywords |
| # of Top 100 Keywords | 3-5% increase month-over-month in keywords that rank in the top 100 |
| Backlinks | 2-3 backlinks each month from unaffiliated, high domain authority sites. |
| Total Monthly Page Views | 5% growth month-over-month |
| Total Monthly Website Visitors | 10% growth month-over-month, with at least 70% of total traffic coming from organic channels |
Each B2B Content Marketing Metric, Explained
In this section, we examine each metric in more detail, namely “What does this metric tell me about the campaign?” and “How can I address a campaign that is underperforming in this category?”
Engagement Rate
| Engagement Rate Benchmark: 63% or higher |
Your engagement rate is the number of engaged visits divided by the total number of visits. An engaged session is any session that lasts 10 seconds or longer, includes more than one page view or leads to a conversion. For example, if you 1,000 total visitors and 100 of them stay on the first page they land on for over 10 seconds, 100 of them vew a second page, and another 100 fill out a contact form, your engagement rate would be 300/1000, or 30%.
Low engagement rates are generally an indicator that your content quality needs to be improved, or that your pages are written with the wrong search intent in mind. Your pages need to immediately convey to searchers that you have the answer they’re looking for and also that you’re an authority on the subject, in other words they should be thought-leadership.
Conversion rate
| Conversion Rate Benchmark: 2–5% or higher |
Conversion rate is similar to engagement rate, but takes into account only conversion events. A conversion can refer to several different actions: it can be a white paper download, clicking on a “request a demo” page, an email list signup, a contact form fill, or any other action that the user takes to indicate interest in your products or services. A useful way you can think of it is that a conversion is basically anything a visitor to your site does that will get them into your customer database.
Depending on your industry, your overall conversion rate should be between 2 and 5 percent. If your internal metrics show that you’re falling short of this number, make sure your website follows conversion optimization best practices, particularly on your highest traffic pages. If your pages aren’t skimmable, don’t include a call to action, or are simply visually unappealing, your conversion rates will suffer. Another common issue is that your highest ranking pages don’t adequately match the search intent of your visitors, causing them to click off before converting. In these cases, you’ll also see low engagement rates.
Time On Page
| Time on Page Benchmark: 37 seconds or higher |
This is a pretty straightforward measurement — the time it takes a visitor to land on your page to the time they move to the next — but its meaning is full of nuance. If your average time on page is very low (under 20 seconds) this is a clear indication that your website presents a poor first impression. But let’s say your website has an average time on page of 45 seconds. Is that good or bad?
The answer isn’t so simple: You need to ask more questions:
- Did the visitor spend enough time to get the information they wanted from the page? For example, if it was a simple product page, 45 seconds can be long enough for them to make the purchase (and this is where conversion tracking comes in).
- Is this more time than visitors were spending last month? This will tell you if your content is more engaging than it was previously, with brighter writing, more interesting graphics, and greater skimabilty.
- Where did the visitors go when they left that page? If they remained on your site,
All of the above will help you answer the question: “Does the design of your pages encourage visitors to stick around or does it push them away?
A related metric is “session time,” which measures how long a visitor says on your site, not a single page. While you might be disappointed that someone is only spending a little time on your blog, if they’re moving from the blog to a contact form and requesting a sales call, that’s what really matters.
Total # of First Page Keywords
| First Page Keywords Benchmark: 10% growth year-over-year |
This is where the rubber hits the road: whether or not your content makes it to the first page of Google search result. This will take time, especially during the early stages of a campaign, which is why we look at year-over-year numbers. Your goal will be to see your pages rank in the top 3-5 results first for your most transactional keywords, with your hubs following later.
If your results are lackluster, revisit your strategic planning process. Here’s what that process should look like:
- First, determine your most valuable, holy grail keywords
- List each transactional, longtail variant of those keywords
- Rank each keyword by its revenue-generating potential
- Determine the search intent of someone using those keywords
- Assign each keyword a page type based on its search intent
Then, your content marketing campaign needs to produce and publish the best pieces of information on the Internet, twice a week. This is easier said than done, but reaching the first page is a long-term goal.
Total # of Top 100 Keywords
| Keywords in Top 100 Benchmark: 3-5% growth month-over-month |
Much like the above metric, you should also track how many keywords you rank for in the top 100. While a keyword on page 7 is very unlikely to result in a conversion, this allows you to track your campaign progress in greater detail than simply looking at the first page keywords. As such, the steps to resolving a lagging keyword count are the same as above: use the Hub & Spoke model to plan your content, produce high quality content thought leadership, and publish at least twice weekly.
Backlinks
| Backlink Benchmark: 2-3 high quality backlinks from new domains each month |
Defined as links from one website to another, backlinks are used by Google’s algorithm as an indication of your reputation and authority. While any backlink has the potential to bring you more traffic, and therefore customers, those with high domain authority are much more valuable for your search rankings.
Another benefit of backlinks is simply that they’re another source of traffic. For example, if your website is linked to by the New York Times, you’ll see a great deal of traffic as a direct result of their visitors clicking on the link to your website. You should be seeing at least 2-3 new backlinks per month, and at least 40 percent of your links should be from high domain authority websites.
One way to boost your backlink numbers is reaching out to other companies to arrange a backlink exchange program. Unfortunately, this has the limitations of both finding other people who want to play along and making sure they aren’t competitors.
Instead, the best way to attract links is to create and publish useful content. One of the most effective ways of doing this is to compile your internal data into quantitative reports on relevant statistics and benchmarks in your industry. This kind of data is often very difficult to find outside of paywalled content, and will quickly become a valuable resource for others, and a link magnet for you.
Total Monthly Page Views
| Monthly Page View Benchmark: 5% growth each month |
Total page views is a metric that is easy to understand, and it will give you a sense of how your traffic fluctuates over time. Perhaps you’ll see one time of year is busier than others for your site. Those are the times when publishing new content is most important or times when maintenance and shutdowns should be limited to disrupt the fewest visitors.
You should also look at your total monthly page views in comparison to the total number of unique visitors. This will tell you how many pages the average visitor sees. Most website visitors see about 2 to 4.5 pages per visit. More than that and you’re doing well, especially if the additional pages show your visitors moving through the sales and conversion funnel.
Total monthly website visitors
| Monthly Website Visitor Benchmark: 10% growth each month |
Again, an easy-to-understand metric. More traffic means more conversions, which in turn means more leads. As a general rule, you want to see organic traffic grow by about 10 percent a month. You can further track not only where those visitors go on your site, but whether or not they return for a second or third visit. A healthy website will see 4-5 percent of visitors return within 90-days of their first visit.
How To Improve Your B2B Content Marketing Metrics
Together, these metrics allow you to accurately measure the success of your marketing campaign. But knowing how to measure success and actually executing on it are different things. The latter requires both expertise and time.
If you don’t have the capability of executing a successful B2B content marketing campaign in-house, working with an agency that understands how to do so makes a lot of sense. First Page Sage has over a decade of experience working with firms in a variety of B2B industries.
If you’d like to learn more, here’s how to get in touch.