How effective is B2B content marketing in the real world? We analyzed our proprietary dataset, comprising B2B businesses who engaged in content marketing campaigns with our firm from 2016-2021, and compiled the results.
In the table below, we share engagement and performance metrics across all industries, as well as average time investment, cost, time to break-even, and ROI.
After that, we segment our data by industry, offering average time on site, traffic-to-lead conversion rate, and ROI.
B2B Content Marketing Statistics
| Metric | B2B Average | Notes |
| Monthly Increase in Organic Web Traffic | 10.5% | This level of increase is expected after ~8 months of consistent, high quality content production. |
| Engagement Rate | 71% | Engagement rate, as used in Google Analytics 4, is the ratio of engaged sessions to total sessions |
| Average Time On Page | 1:24 | Google requires only a time on page of 10 seconds for a session to be considered “engaged”. However, longer times on page correlate with higher content quality and relevancy. |
| Weekly Time Investment | 2 hours (outsourced)
8 hours (in-house) |
Assumes 2 articles or other pieces of content published each week |
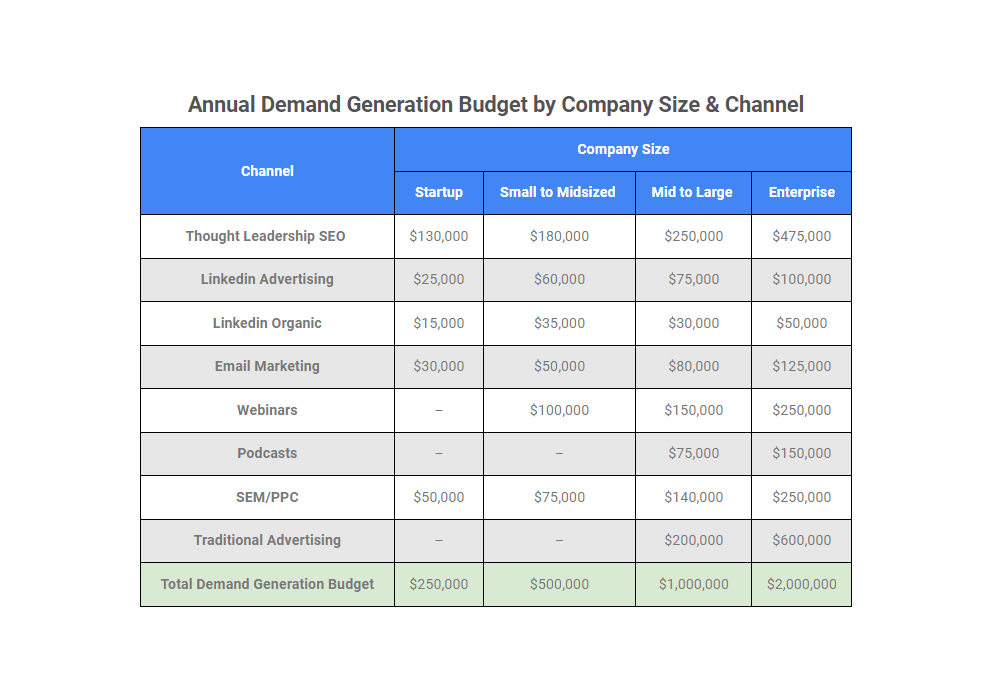
| Monthly Cost | $9,150 (outsourced)
$11,120 (in-house) |
Outsourced assumes 2 new pages published each week. In-house includes taxes, benefits, and training |
| Time to Break-Even on Investment | 10 months | Investment pays off sooner with thoughtful strategic planning utilizing the hub and spoke model of content marketing |
| ROI | 748% | Assumes consistent weekly publication; consideration of search intent; and a high quality of content |
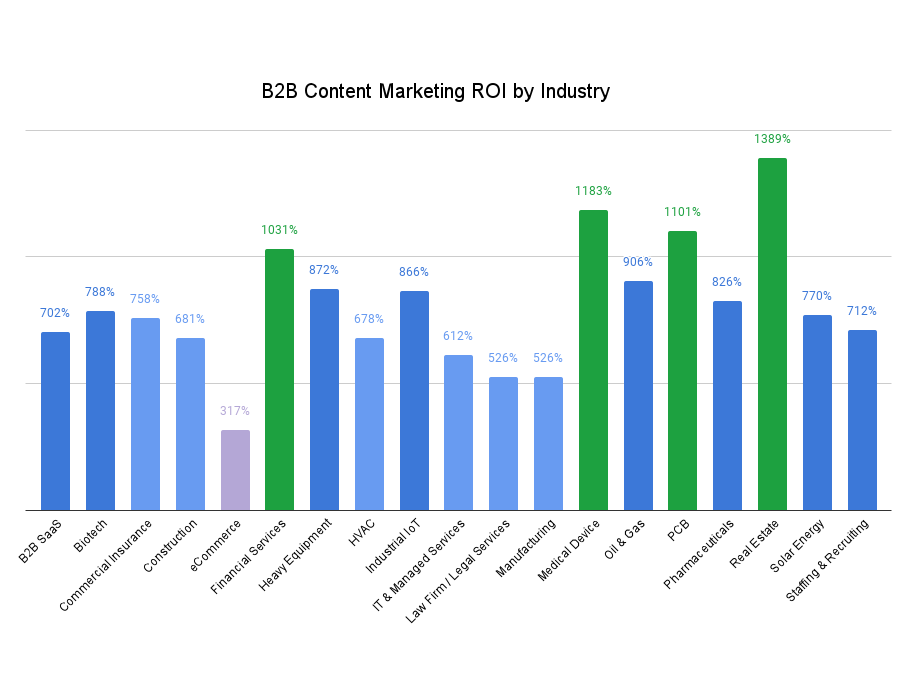
B2B Content Marketing Statistics by Industry
| Industry | Average Time On Site | Lead Conversion Rate | ROI |
| B2B SaaS | 4:26 | 1.1% | 702% |
| Biotech | 2:56 | 1.8% | 788% |
| Commercial Insurance | 4:06 | 1.7% | 758% |
| Construction | 3:18 | 1.9% | 681% |
| eCommerce | 2:03 | 1.6% | 317% |
| Financial Services | 4:56 | 1.9% | 1,031% |
| Heavy Equipment | 2:53 | 1.7% | 872% |
| HVAC | 2:56 | 3.1% | 678% |
| Industrial IoT | 3:17 | 2.6% | 866% |
| IT & Managed Services | 4:16 | 1.5% | 612% |
| Law Firm / Legal Services | 3:07 | 7.4% | 526% |
| Manufacturing | 3:37 | 2.1% | 526% |
| Medical Device | 3:58 | 3.1% | 1,183% |
| Oil & Gas | 4:13 | 2.6% | 906% |
| PCB | 4:18 | 2.3% | 1,101% |
| Pharmaceuticals | 3:47 | 1.9% | 826% |
| Real Estate | 3:52 | 2.8% | 1,389% |
| Solar Energy | 2:56 | 1.8% | 770% |
| Staffing & Recruiting | 3:48 | 2.9% | 712% |
Optimizing Your B2B Content Marketing Campaign
The statistics above, averages from 120+ content marketing campaigns with varying results, depend on a thoughtful implementation of content marketing and SEO, as well as the utilization of conversion optimization best practices on each page.
If your team lacks some of the specialized skills necessary to deliver a content marketing campaign of this caliber, our agency specializes in B2B content marketing, particularly within complex industries, and always with a focus on lead generation. You can reach us here.