Last updated: November 9, 2023
In this report, we provide benchmarks for marketing performance along each step of the B2B SaaS conversion funnel. We will begin with definitions and average conversion rates for each step and proceed to break down conversion rate benchmarks by marketing channel, industry, and target audience company size.
Our data set comes from access to 50+ B2B SaaS clients over the last decade, mostly small-to-midsize businesses in the $10M-$100M revenue range. It includes a good amount of exposure to the middle market as well as a smaller, but still substantive, pool of data from enterprise clients.
B2B SaaS Funnel Benchmarks: Definitions
We use a six-step funnel that should be familiar to anyone in marketing at a B2B SaaS company. It consists of:
- Website visitor
- Lead
- MQL
- SQL
- Opportunity
- Closed
A lead is any non-spam website visitor who has submitted contact information. An MQL is a lead who fits the company’s target market or one of its customer personas. An SQL is an MQL who has indicated that the product is desirable, within their budget, and is speaking with a salesperson. An opportunity is an MQL with contract in hand.
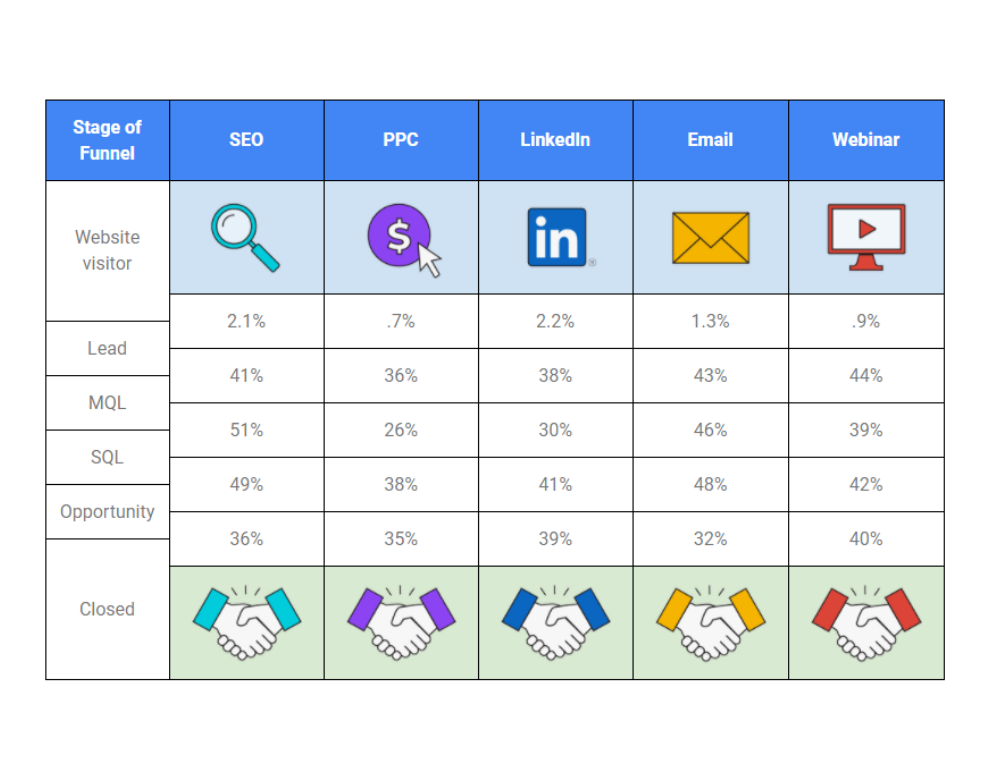
B2B SaaS Funnel Conversion Benchmarks by Channel
In this section, you’ll find conversion rate benchmarks for each step in the funnel, further broken down by the five most common B2B marketing channels for which we have data.
When using these benchmarks for your marketing activities, bear in mind that there is an assumption of a high level of competence from the team or agency conducting the activity. For example, in SEO that means having a thought leadership-based strategy; in PPC, it means consistent testing of landing pages to achieve a high-quality score; and in email marketing, it means using a well-targeted list.
| Stage of Funnel | SEO | PPC | Webinar | ||
| Website visitor | |||||
| 2.1% | .7% | 2.2% | 1.3% | .9% | |
| Lead | |||||
| 41% | 36% | 38% | 43% | 44% | |
| MQL | |||||
| 51% | 26% | 30% | 46% | 39% | |
| SQL | |||||
| 49% | 38% | 41% | 48% | 42% | |
| Opportunity | |||||
| 36% | 35% | 39% | 32% | 40% | |
| Closed | |||||
B2B SaaS Funnel Conversion Benchmarks by Industry
Below, we break down conversion rates at each step of the funnel by industry.
- Adtech
- Automotive
- CRM
- Chemical / Pharmaceutical
- Cybersecurity
- Design
- Edtech
- Entertainment
- Fintech
- Hotel & Hospitality
- Industrial & IIoT
- Insurance
- Legaltech
- Medtech
- Project Management
- Retail / eCommerce
- Telecommunications
Adtech
| Funnel Stage | Adtech Conversion Rates |
| Visitor to Lead | 1.4% |
| Lead to MQL | 39% |
| MQL to SQL | 35% |
| SQL to Opportunity | 40% |
| Opportunity to Close | 37% |
Adtech is a crowded field with relatively low conversion rates across the board.
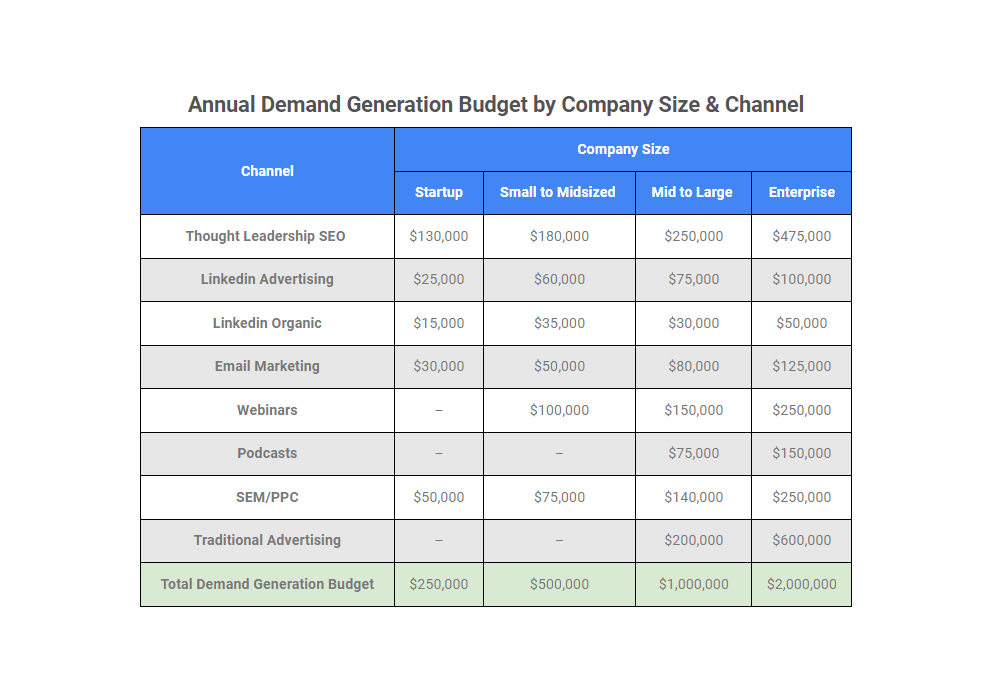
B2B SaaS Funnel Conversion Benchmarks by Target Audience Company Size
Our final set of conversion rate benchmarks is broken down by the size of the companies being targeted by marketing and sales. There are several commonly used categories for company size—we chose a simplified scale based on revenue (<$10M, $10M-$100M, $100M-$1B, and >$1B).
| Stage of Funnel | Small Business ($1M-$10M) | Small-to-Midsize ($10M-$100M) | Middle Market ($100M-$1B) | Enterprise ($1B+) |
| Website visitor | ||||
| 2.3% | 1.4% | 1.2% | .7% | |
| Lead | ||||
| 37% | 41% | 40% | 34% | |
| MQL | ||||
| 32% | 39% | 39% | 40% | |
| SQL | ||||
| 40% | 42% | 46% | 36% | |
| Opportunity | ||||
| 46% | 39% | 35% | 31% | |
| Closed | ||||
Using Conversion Funnel Benchmarks
The above benchmarks will help you assess your marketing strategy and allow you to make more informed decisions. If you’d like to know more about our method or data set, or are interested in working with our agency for lead generation, feel free to reach out.
Further Reading
You may also be interested in these related B2B SaaS reports: