[vc_row][vc_column][vc_column_text]Last Updated: September 28, 2023
The valuation multiple tables below reflect data collected by our analysts between H2 2022 and H2 2023 on private company M&A transactions within the tech sector. They contain average EBITDA and revenue multiples for tech companies within 9 industries, which we further subdivide by EBITDA or revenue range. Our dataset was built from an amalgam of paid private equity databases and proprietary deal records from M&A professionals. (Sources)
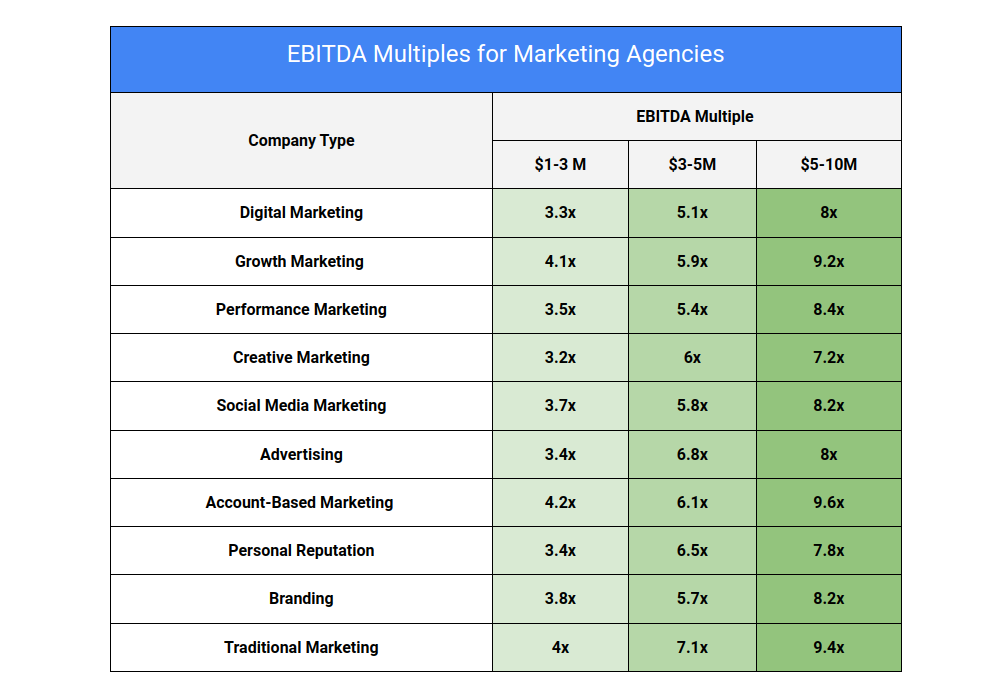
EBITDA Multiples for Private Tech Companies, H2 2022 – H2 2023 |
|||
| Industry | EBITDA Range | ||
| $1-$3M | $3-$5M | $5-$10M | |
| Adtech | 7.1x | 9.2x | 10.6x |
| Agtech | 8.3x | 10x | 11.4x |
| B2B SaaS | 8.9x | 10.9x | 12.6x |
| Cybersecurity | 9.1x | 11.3 | 12.8x |
| Fintech | 9.6x | 11.8x | 12.3x |
| Hosting | 7.4x | 9.1x | 11.2x |
| Managed Services | 7.9x | 9.8x | 10.9x |
| SaaS | 8.7x | 11.2x | 12.5x |
| Semiconductors | 9.4x | 11.5x | 12.8x |
| Software Development | 8.2x | 9.9x | 11.9x |
Revenue Multiples for Private Tech Companies, H2 2022 – H2 2023 |
|||
| Industry | Revenue Range | ||
| $1-$5M | $6-$10M | $10-$75M | |
| Adtech | 1.9x | 2.6x | 2.8x |
| Agtech | 2.2x | 2.5x | 3x |
| B2B SaaS | 2.3x | 2.8x | 3.2x |
| Cybersecurity | 2.5x | 2.7x | 3.3x |
| Fintech | 2.6x | 2.9x | 3.5x |
| Hosting | 1.4x | 2.1x | 2.6x |
| Managed Services | 1.9x | 2.3x | 2.8x |
| SaaS | 2.4x | 2.8x | 3.1x |
| Semiconductors | 2.6x | 3x | 3.5x |
| Software Development | 1.8x | 2.5x | 3.2x |
The following sections provide context for the multiples listed above by discussing the current state of tech M&A, as well as common factors affecting the valuation of tech companies.
The State of Tech M&A in 2023
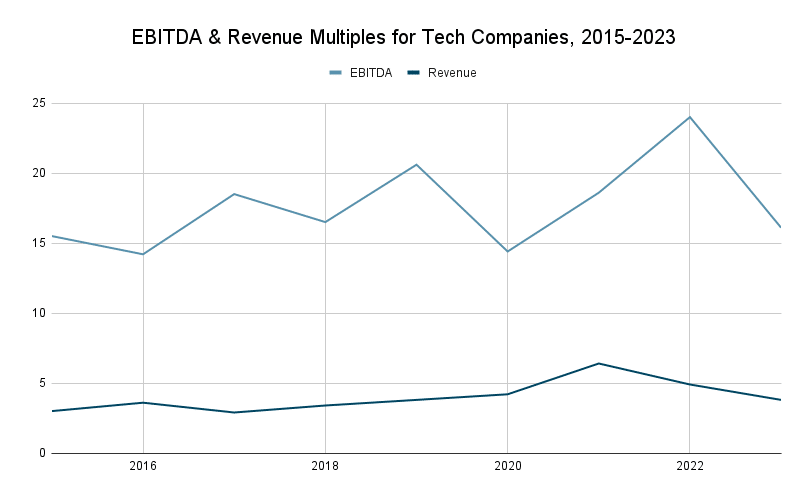 Until recently, the tech industry was thought of as a relatively stable, reliable field in which to invest. With the onset of the pandemic in 2020, these multiples rapidly rose, largely due to the growing need for tech solutions in the face of work-from-home mandates. When the economic downturn started in H2 2022, these multiples fell, as many tech companies couldn’t produce value at the scale of their projected worth.
As it sits now, the tech industry is going through something of a reckoning within M&A. The last two years in particular have seen great use of revenue multiples to mask a lack of quantifiable data establishing profitability in tech startups with heavy sunken costs. This tactic earned many tech companies a higher payout in frothier times, however buyers in 2023 have grown more stringent in their acquisition choices, demanding a clear path to profitability before considering a purchase.
Despite these overall considerations, the future impact of tech companies is undeniable. With an expected industry CAGR of 9.5%, tech fields are expected to grow into a conglomerated industry worth over $600b by 2030, with overall growth being led by fast-growing sectors like business intelligence and customer analytics.
Predictions
Based on our read of the market, our research team has the following assumptions about the future of the tech industry:
- Valuation multiples will continue to decline moderately as the risk in speculative fields of tech become more apparent and buyers become more wary.
- EBITDA will likely regain its original prominence, with investors having previously relied too heavily on revenue multiples that do not indicate a company’s profitability.
- PE Firms & Strategics will favor smaller tech companies, as the weaker market will tempt buyers to save cash and put more sweat equity into deals, rehabbing businesses over time.
Factors Affecting Multiples
With publicly-available deal information available for approximately 306 deals in 2022, our research team identified not only the valuation multiple averages listed above, but also the criteria upon which those multiples were earned.
The table below identifies these criteria, as well as an approximated weight for each. This weight was determined by the overall impact their absence or presence appears to have had on offers made.
Valuation Factors For Tech Companies, Weighted |
||
| Factor | Description | Weight |
| Cash Flow | Profit sustained over at least a 24 month period | 40% |
| Company Size & Age | An established infrastructure, base of operations, and labor force, sustained over multiple years | 35% |
| Owner Dependency | The ability to replace the owner after a 12-36 month earnout | 20% |
| Customer Base | A growing customer base with high loyalty and low churn | 5% |
It should be noted that additional factors (e.g. geography, specialization) were factored into a company’s valuation. The difference between these smaller examples and the four listed above is that the examples on the table were noted in more than 90% of deals listed, indicating a greater reliance on them on the part of buyers in both PE firms and strategics.
Selling a Tech Company
Anyone who has sold a company before will tell you that it’s a complicated experience, regardless of the seller, industry, or EBITDA range. This is especially true in the 2023 market, where micro-concerns about a company’s future meet the macroeconomic turbulence.
I have sold several tech companies myself and am happy to offer advice from a neutral, third-party perspective. You can reach me via the link below or through the contact page on this website.[/vc_column_text][/vc_column][/vc_row][vc_row][vc_column][vc_tta_accordion active_section=”666″][vc_tta_section title=”Sources” tab_id=”1686156312311-4f1c5268-37a1″][vc_column_text]
- Valuation Multiples for Tech Software Companies [2023 Updated] (Microcap)
- A Guide to Valuing Tech, Software & Online Businesses (Morgan & Westfield)
- Software Valuation Multiples: 2015-2022 (Aventis Advisors)
- Enterprise Software: 2022 Valuation Multiples (Finerva)
- How to value a technology business (Isosceles Finance)
- Valuing high-tech companies (McKinsey & Company)
[/vc_column_text][/vc_tta_section][/vc_tta_accordion][/vc_column][/vc_row]